Figures & data
Figure 1. Simultaneous thrombin and plasmin generation. (A) First derivative of TG (−−−−) and PG (––––) experiment derived from a measurement in a single well. Thrombin generation signal was divided in four parameters: (1) lag time (minute), (2) thrombin peak time (minute), (3) thrombin peak height (nM), (4) area under the curve (AUC) (nM-minute). PG yielded three parameters: (5) the plasmin peak (nM), (6) the fibrin lysis time (FLT) (minute) and (7) plasmin potential (nM-minute). Surrogate peak time is marked by * and plasmin peak time is marked by #.
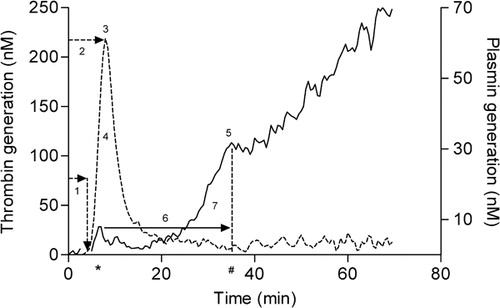
Table 1. Kinetic constants of the thrombin and plasmin substrate. Assays were performed as described in the text with 8 nM plasmin, 50 nM thrombin, 14 nM FXa or 10 μM APC. kcat was expressed as s−1and was calculated from the V values and enzyme concentrations
Figure 2. Concentration effects of start reagents in the NHA. The effect of different concentrations (A) TF and (B) cephalin on a TG curve and tPA on a TG (C) or PG (D) curve. (A) NPP was incubated with final dilutions of 1∶600 (double dotted striped), 1∶6000 (dot striped), 1∶15 000 (dotted), 1∶30 000 (bold), 1∶60 000 (striped) or no (solid) TF, (B) Cephalin was added in the following dilutions of 1∶30 (solid), 1∶60 (bold), 1∶120 (striped), 1∶2400 (dotted), 1∶1·2×105(dot striped) or no cephalin (double dotted striped), (C, D) TPA was added in a concentration of 300 (solid), 230 (striped), 193 (bold), 110 (dotted) and 75 IU/ml (dot striped) tPA. Bold lines indicate concentrations used in a standard NHA assay. To improve graphical representation of the simultaneously measured TG and PG experiments only the relevant results were illustrated.
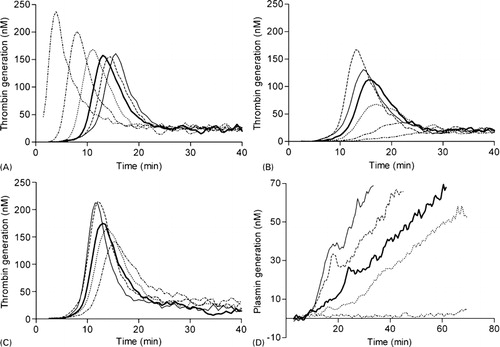
Figure 4. Superimposition of TG and PG with F1+2 and PAP complex respectively. Thrombin generation (solid; right vertical axis) compared with (A) log F1+2 generation (▪; left vertical axis) and (B) PG (striped; right vertical axis) compared with PAP formation initiated with (▪; left vertical axis) or without (•) 193 IU tPA. To improve graphical representation of the simultaneously measured TG and PG experiments only the relevant results were illustrated.
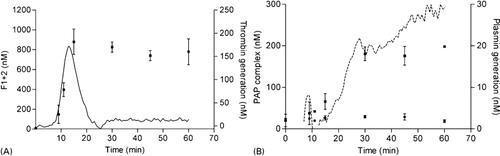
Table 2. Inter- and intra-assay variation for all parameters as measured in the NHA. The intra-assay variation was determined with eight replicate NPP samples and the inter-assay variation was calculated using a single sample per day measured over 10 different days
Table 3. Reference ranges of TG and PG parameters determined in citrate plasma of healthy controls (n = 45)
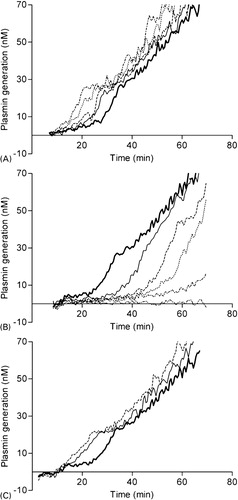
Figure 3. In vitro validation of the NHA. Effect of heparin (A), hirudin (B) on TG and epsilon-aminocaproic acid (C), GPRP (D) and reptilase (E) on PG. NPP was incubated with final concentrations of (A) 0 (bold) 42 (solid), 62 (striped) 83 (dotted) or 167 (dot striped) mIE/ml heparin, (B) 0 (bold), 2 (solid), 8 (striped), 17(dotted), 33 (dot striped) or 83 (double dotted striped) IU/ml hirudin, (C) 0 (bold), 0·4 (solid), 0·8 (striped), 2·1 (dotted), 4·2 (dot striped) or 8·3 (double dotted striped) nM epsilon-aminocaproic acid and (D) 0 (bold), 2 (solid), 8 (striped), 17 (dotted), 33 (dot striped) or 83 (double dotted striped) IU/ml GPRP. (E) demonstrates PG of NPP (bold) and fibrin-depleted NPP after reptilase treatment (solid). To improve graphical representation of the simultaneously measured TG and PG experiments only the relevant results were illustrated.
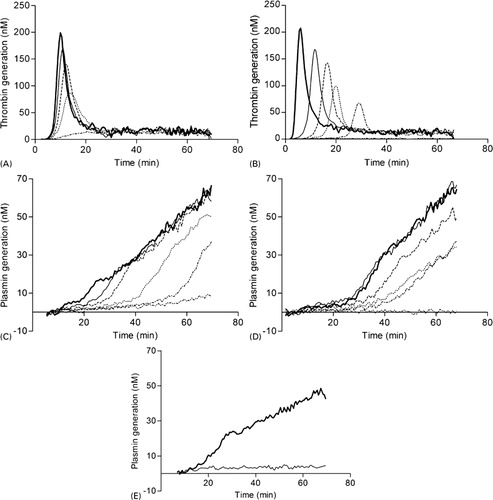
Figure 5. The effect of APC, TM and CPI on fibrinolysis mediated by TAFI. NPP was incubated with final concentrations of (A) 0 (bold) 1·7 (solid), 2·6 (striped) 4·1 (dotted) or 10·3 (dot striped) μg/ml APC, (B) 0 (bold), 0·085 (solid), 0·17 (striped), 0·34 (dotted), 10 (dot striped) or 100 (double dotted striped) nM TM and (C) control (bold), 8 μM CPI (solid) and 8 μM CPI+0·68 nM TM (striped). To improve graphical representation of the simultaneously measured TG and PG experiments only the relevant results were illustrated.