Figures & data
Figure 1. mRNA expression levels of MAGE-A3 in DLBCL stages. (A) Expression of MAGE-A3 in DLBCL. Lane 1, 100-bp ladder; lane 2, testicular tissue; lane 3, PBLs from a healthy donor; lanes 4–11, DLBCL representative samples. (B) Real-time RT-PCR. The expression results were obtained from eight samples from stage II DLBCL patients; nine from stage III and eight from stage IV. Significant differences between results (P<0·05) were obtained by means of parametric test. T, testicular tissue.
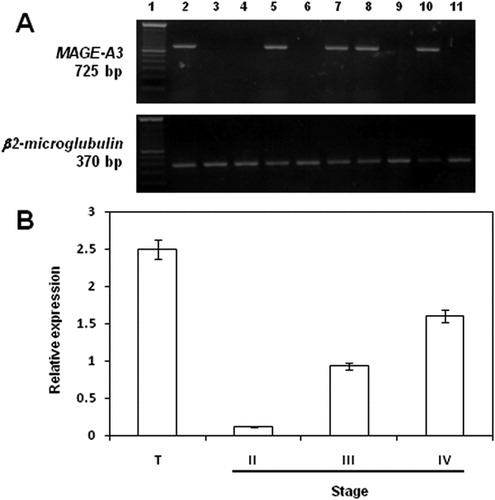
Table 1. Association between clinical characteristics and MAGE-A3 expression in DLBCL patients
Figure 2. Protein expression of MAGE-A3/A6 in DLBCL stages. (A) MAGE-A3/A6 protein expression in DLBCL. Lane 1, PBLs from a healthy donor; lane 2, testicular tissue; lanes 3–11, DLBCL representative samples. (B) Densitometric semiquantification of the protein bands.
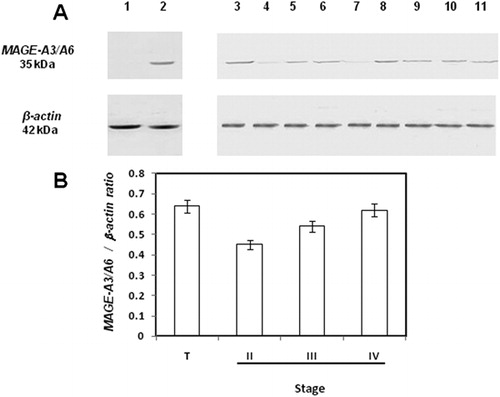
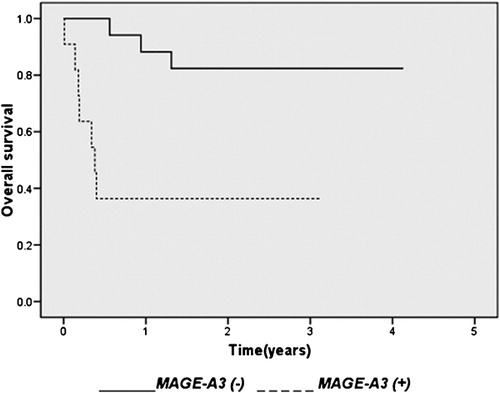
Figure 3. Survival according to MAGE-A3 expression in DLBCL. Overall survival in 11 patients with MAGE-A3 (+) and 17 patients with MAGE-A3 (−) DLBCL (P< 0·001).