Figures & data
Figure 1. Representation of restriction digest results of 14 samples after PCR on 2% high resolution agarose gel electrophoresis. A distinctive 207 bp band is expected for a mutated sample when digested with DdeI. Lane 8 shows patient sample with T315I mutation. Potential band sizes for both mutated and unmutated samples after digestion can be seen on the right hand side. M: Marker (50 bp DNA ladder), U: uncut control.
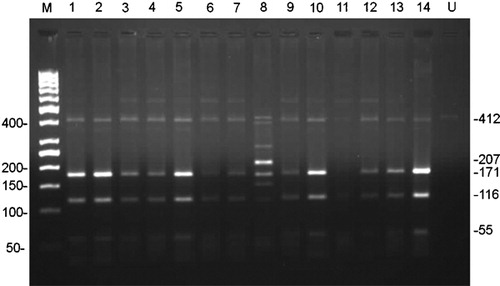
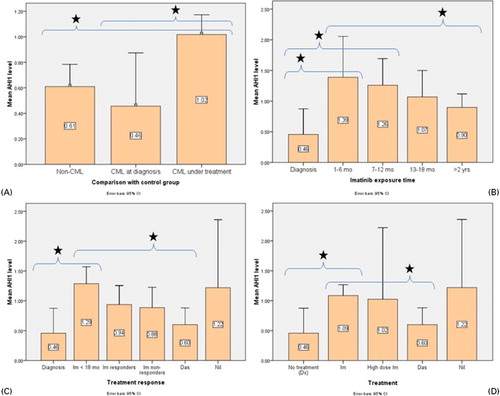
Figure 2. Comparison of mean AHI1 levels in different groups of patients. Means are shown inside each bar. Das: dasatinib; dx: diagnosis; Im: imatinib; mo: months; nil: nilotinib; yrs: years.