Figures & data
Table 1. Patients’ characteristics
Figure 1. Mononuclear PB cells from AML patients were analyzed by FACS analysis using fluorochrome labeled anti-FR/FL and TR1/TR2 antibodies. Percentages of myeloid cells and T cells for the respective FR, FL and TR1, TR2 co-expressions are presented on MNCs from AML patients at first diagnosis compared to healthy probands. (A) Co-expression of FasR or FasL and TrailR1 or TrailR2 on myeloid cells. (B) Co-expression of FasR or FasL and TrailR1 or TrailR2 on T cells.
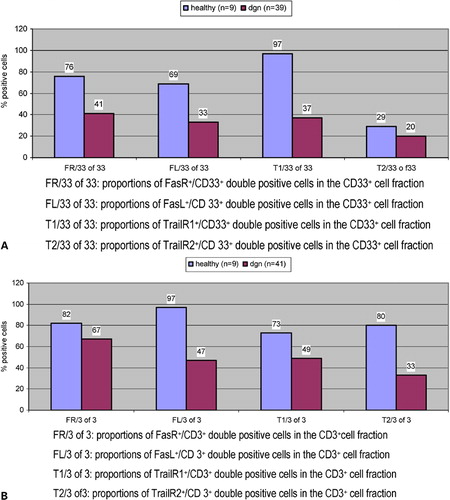
Figure 2. Mononuclear PB cells from AML patients were analyzed by FACS analysis using fluorochrome labeled anti-FR/FL and TR1/TR2 antibodies. Percentages of myeloid cells and T cells for the respective FR, FL and TR1, TR2 co-expressions are presented on MNCs from AML patients in different stages of AML. (A) Percentages of myeloid cells and T cells for the respective FR, FL and TR1, TR2 co-expressions are presented on MNCs from AML patients in pAML compared to sAML. (B) Percentages of myeloid cells and T cells for the respective FR, FL and TR1, TR2 co-expressions are presented on MNCs from AML patients in favorable vs poor cytogenetic risk group. (C) Percentages of myeloid cells and T cells for the respective FR, FL and TR1, TR2 co-expressions are presented on MNCs from AML patients in the responder compared to the non-responder-group to chemotherapy.
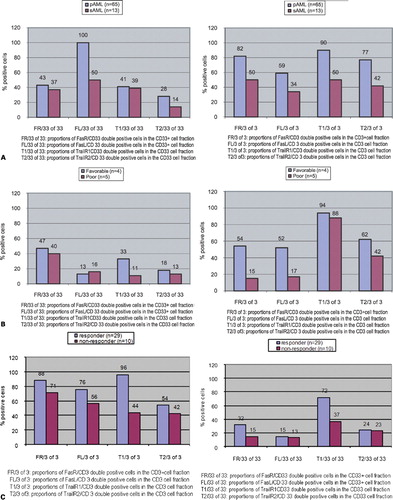
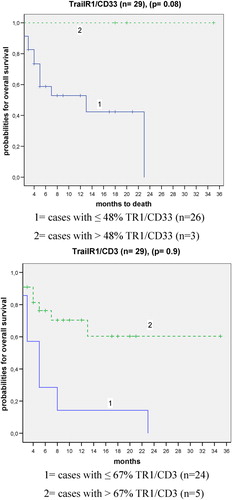
Figure 3. Mononuclear PB cells from AML patients were analyzed by FACS analysis using fluorochrome labeled anti-FR/FL and TR1/TR2 antibodies and percentages of myeloid cells and T cells co-expressing the respective FR, FL and TR1, TR2 markers evaluated. Cases were separated each in two prognostic groups after evaluating a cut-off value representing the value of maximum probability with a most significant differentiation between cases with a shorter or longer overall survival. Kaplan–Meier plots and the respective P values by log-rank test for TR1/CD33 and TR1/CD3 co-expressions are given.