Figures & data
Table 1. XRCC1 (A399G), XPD (−751), XRCC4 (VNTR in intron 3 and G-1394T) primer sequences, restriction enzymes and amplification conditions (on over night incubation)
Table 2. Clinical characteristics and treatment regimens of multiple myeloma patients
Table 3. Comparison of genotype of XPD, XRCC1, XRCC4 gene polymorphisms between patients with multiple myeloma and healthy controls
Figure 1. Kaplan–Meier plots on overall survival (OS) time according to the type of IPI risk score at diagnosis.
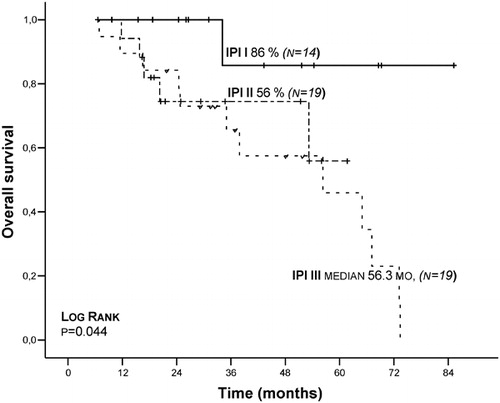
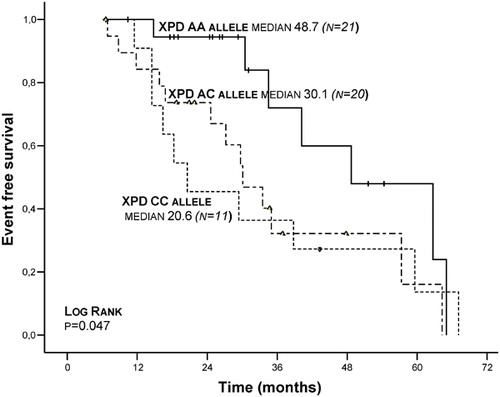
Figure 2. Kaplan–Meier plots on event-free survival (EFS) time according to the type of XPD (Lys751Gln) genotypes.