Figures & data
Figure 1. Serum endocan levels for untreated acute myeloid leukemia (AML) patients and healthy controls. The figure presents endocan levels (ng/ml) for a consecutive group of 40 patients with untreated AML (AML) and a group of 21 healthy controls (Ctrl). The corresponding P value is indicated at the top of the figure.
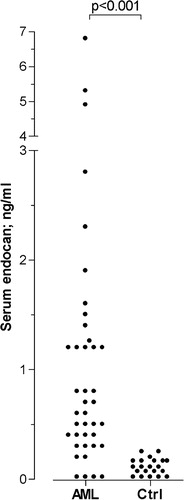
Figure 2. Serum endocan levels for acute leukemia patients before treatment (B) and after development (A) of severe chemotherapy-induced pancytopenia with peripheral blood neutrophil counts <0·5×109/l and dependency on regular platelet transfusions. The figure shows the results for those patients in patient group 1 that could be sampled before start of chemotherapy and after the development of treatment-induced cytopenia but before the development of complicating infections. When the second sample was collected, the patients were cytopenic, and had no fever and neither other systemic nor local signs of bacterial infection, and a stable serum CRP level below 50 mg/l. The figure shows the overall results for patients receiving induction (stippled line) or consolidation chemotherapy (solid line) and the corresponding P value is indicated at the top.
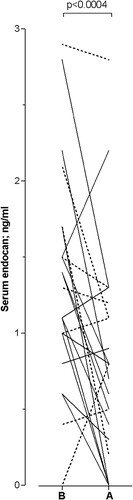
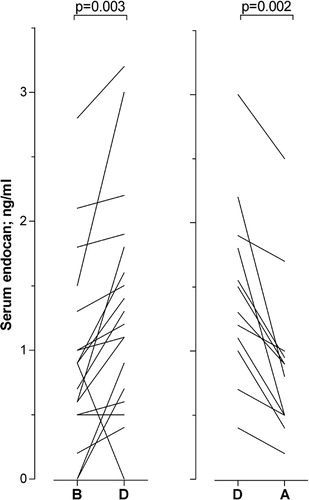
Figure 3. Serum endocan levels for acute leukemia patients with severe chemotherapy-induced pancytopenia before, during, and after the development of complicating bacterial infections (patient group 1). All patients had peripheral blood neutrophil counts <0·5×109/l and were dependent on regular transfusions to maintain platelet counts above 10–20×109/l at the time of sampling. The figure compares (left part) the serum endocan levels (ng/ml) for those patients that could be sampled before (B) and during the bacterial infection (D); and (right part) serum levels for patients that were cytopenic both during the infection (D) and also after clinical improvement due to antibiotic therapy (A). Clinical improvement means that they were afebrile with normalization of the serum CRP level. Corresponding P values are indicated at the top of the figure.