Figures & data
Figure 1. Expression of EBV genome and HIV mRNA. EBV transformation of LCLHIV (Is, Sh, Ku, Ni) and LCLN (Ki, Ma, Hi, Na) was confirmed by DNA PCR (A). The amplified EBV band was 142 bp. HIV infection was determined by RT-PCR (B). The expected HIV band was 134 bp; however, no band was observed.
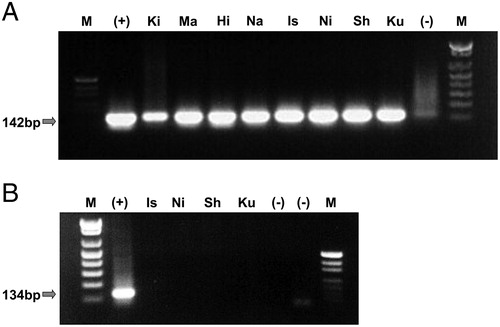
Figure 2. Expression of adhesion molecules in LCLs by FACS. (A) Expressions of CD11a, CD11b, CD18, CD50, and CD54 were determined by FACS. The expression of CD18 by LCLHIV was significantly greater than that by LCLN. (B) Expressions of CD18 by LCLHIV and LCLN at several culture stages. The expression of CD18 in LCLHIV (Is, Sh, Ku, Ni) was significantly greater than that in LCLN (Ki, Ma, Hi, Na) by FACS at 0 hour (*P = 0.0102), 24 hours (**P = 0.0320), and 48 hours (***P = 0.0291).
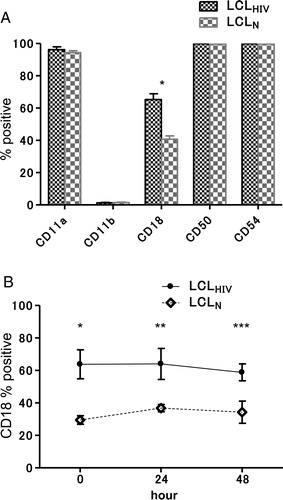
Figure 3. Effects of simvastatin or AZT on proliferation of LCLs. Proliferation curve of LCLHIV (A) or LCLN (B) incubated with or without simvastatin. Effects of AZT on cell growth of LCLHIV (C) or LCLN (D).
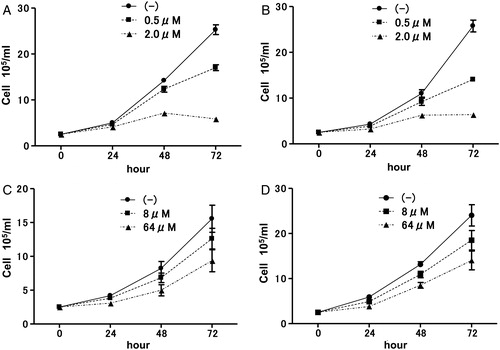
Figure 4. Effects of simvastatin or AZT on CD18 expression of LCLHIV or LCLN. (A) Expression of CD18 by LCLHIV was decreased significantly with simvastatin (*P = 0.0208) or AZT (**P = 0.0113). (B) Simvastatin induced downregulation of CD18 in LCLN (*P = 0.0015), but AZT did not induce downregulation (**P = 0.0887).
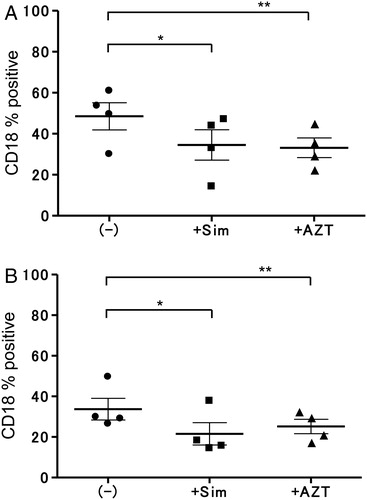
Figure 5. Expression of CD54 and CD18 by ISO-HAS. Expressions of adhesion molecules in ISO-HAS by FACS. ISO-HAS mostly expressed ICAM-1 (CD54, 99.59%). No expression of LFA-1 (CD11a/CD18, 1.82%/1.39%) was detected.
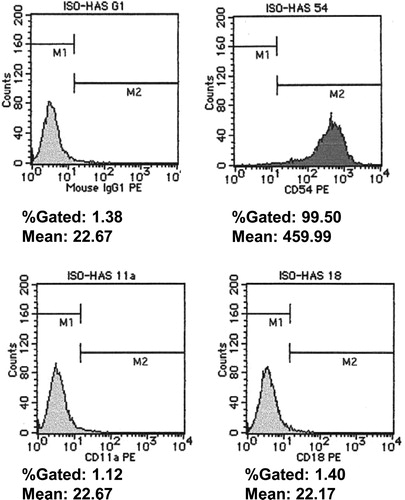
Figure 6. Inhibition of binding between LCLs and ISO-HAS by simvastatin or AZT. (A) The binding rates of LCLHIV and ISO-HAS without reagents were 97–99%. Binding rates were significantly decreased by simvastatin (0.5 µM final conc.) (*P < 0.0001) or AZT (8.0 µM final conc.) (**P < 0.0001). (B) The binding rates between ISO-HAS and LCLN were 30–40% in spontaneous culture. Simvastatin (0.5 µM final conc.) (*P < 0.0001) or AZT (8.0 µM final conc.) induced significantly decreased binding (**P < 0.0001).
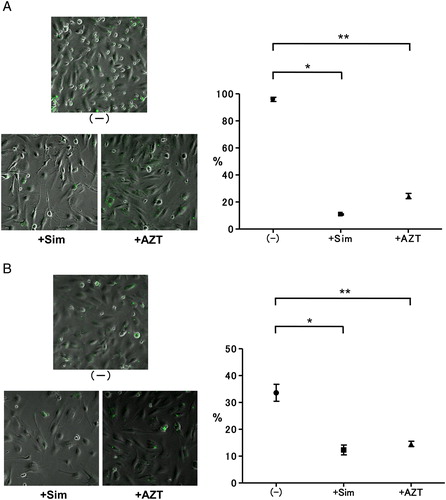
Figure 7. Effects of IL-8 on CD18 expression of LCLHIV or LCLN. Expression of CD18 by LCLHIV (A) or LCLN (B) increased with IL-8 (100 ng/ml final conc.) (LCLHIV, *P = 0.0333; LCLN, *P = 0.0073). (C) IL-8 level in culture supernatant from LCLHIV was higher than that in supernatant from LCLN (*P = 0.0171).
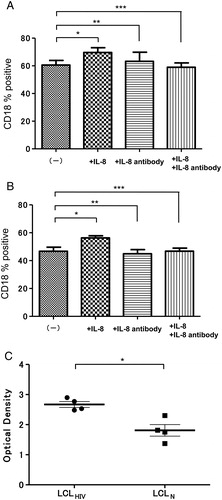
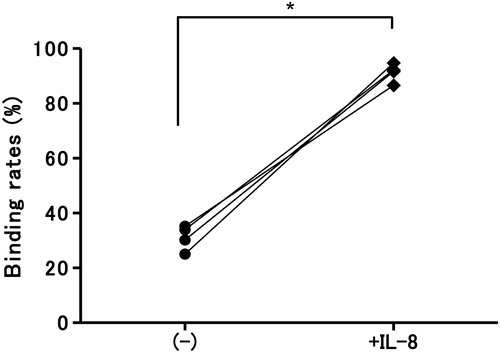
Figure 8. Effects of IL-8 on cell binding between LCLN and ISO-HAS. The binding rate of LCLN and ISO-HAS was augmented significantly when cultured with IL-8 (100 ng/ml final conc.) (*P = 0.0006).