Figures & data
Table 1. Characteristics of SPS patients and the control group
Figure 1. Relationships between genotyped markers block in CEU HapMap population, SPS patients and the control group (LD plots).
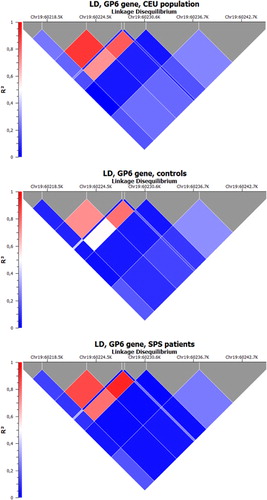
Table 2. Characterization of the examined GP6 SNPs
Table 3. Frequency of alleles of the GP6 SNPs in SPS patients and the control group
Table 4. Frequency of haplotypes of the GP6 SNPs (10 most frequent shown) in SPS patients and the control group
Table 5. Frequency of alleles of the GP6 SNPs in patients with SPS type I and the control group
Table 6. Frequency of haplotypes of the GP6 SNPs (10 most frequent shown) in patients with SPS type I