Figures & data
Figure 1. Calcium uptake (A) and calcium-stimulated ROS (H2O2) generation (B) in mitochondria isolated from rat liver. (A) Mitochondria (0.5 mg protein/ml) were energized with 5 mM succinate (+2 µM rotenone) in a standard medium consisting of 125 mM sucrose, 65 mM KCl, and 10 mM HEPES-KOH pH 7.4, at 30°C; calcium (Ca2+) was determined with arsenazo III as described in Materials and methods. (B) Mitochondria were incubated in the standard medium at 30°C and H2O2 was determined with the Amplex Red probe/HRP as described in Materials and methods. Additions: standard medium + Amplex Red probe/HRP (base line); Mitochondria (M) + 2 µM rotenone + 100 µM EGTA + 5 mM succinate (Suc) (Control); M + 2 µM rotenone + Suc + 10–250 µM calcium (Ca2+). Bars are average ± SEM and traces are representative experiments.
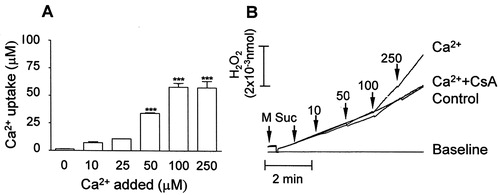
Figure 2. H2O2 generation assessed with the Amplex Red probe/HRP in mitochondria energized with glutamate/malate (A) or succinate (B). Mitochondria were incubated in the standard medium described in , in the presence of 5 mM glutamate/malate (A) or 5 mM succinate (B) as described in Materials and methods; 100 µM EGTA (control) or 100 µM calcium (Ca2+) were added at the initial time (0 seconds). The inhibitors rotenone (Rot, 2 µM), antimycin A (AA, 1 µM), or myxothiazol (Myx, 2 µM) were added after 300 seconds. Bars (A, B) are average ± SEM of the relative fluorescence at 600 seconds from the traces represented in A-1 and B-1. *P < 0.05, succinate vs. glutamate/malate; #P < 0.05 vs. Control; ‡P < 0.05 vs. Ca2+.
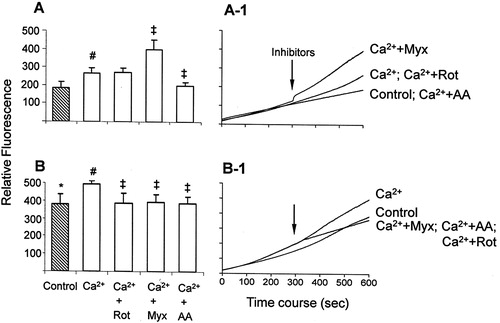
Figure 3. ROS generation assessed with the H2DCFDA probe in mitochondria energized with glutamate/malate (A) or succinate (B). The assays were performed as described in . #P < 0.05 vs. control; ‡P < 0.05 vs. Ca2+.
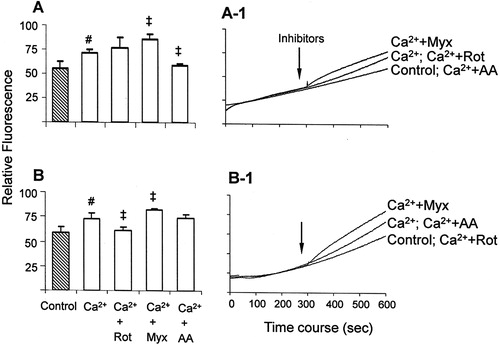
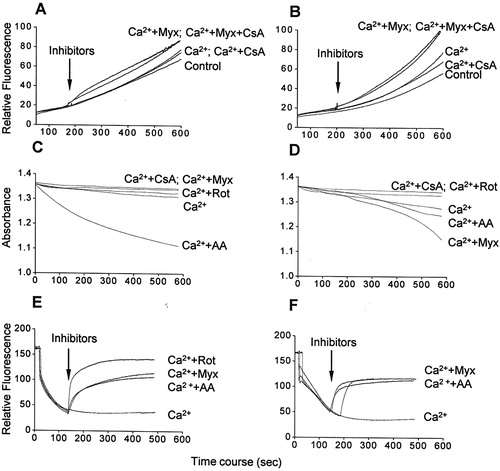
Figure 4. ROS generation (A and B), mitochondrial swelling (C and D), and membrane potential dissipation (E and F) in the presence of calcium/respiratory chain inhibitors in glutamate/malate-energized (A, C, and E) or succinate-energized (B, D, and F) mitochondria. Mitochondria were incubated in the standard medium with 100 µM calcium, as described in and Materials and methods. Additions: only Ca2+ (Ca2+), 1 µM cyclosporine A (CsA), 2 µM rotenone (Rot), 1 µM antimycin A (AA), and 2 µM myxothiazol (Myx). Traces are representative of three independent preparations.