Figures & data
Table 1. E. coli K-12 bacterial strains and plasmids used in this work
Figure 1. Survival of E. coli wild strain (AB1157) (squares) and mutant fpg− (BH20) (triangles) irradiated with different doses of UVC in the presence (filled symbols) or absence (open symbols) of sodium azide. Values are the mean of at least five experiments were submitted to ANOVA test (P < 0.05) followed Tukey's multiple comparison test (P < 0.001).
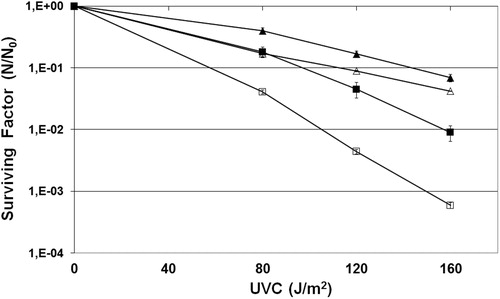
Figure 2. Alkaline gel electrophoresis of E. coli irradiated with UVC (120 J/m2) in the presence or absence of sodium azide with percentual of DNA stand breaks. Lanes: (1) AB1157; (2) AB1157 + UVC; (3) AB1157 + azide; (4) AB1157 + UVC + azide; (5) BH20; (6) BH20 + UVC; (7) BH20 + azide; (8) BH20 + UVC + azide. The image represent a single experiment and the collected data of three experiments were submitted to the χ2, adopting 5% as the significance level (P < 0.001).
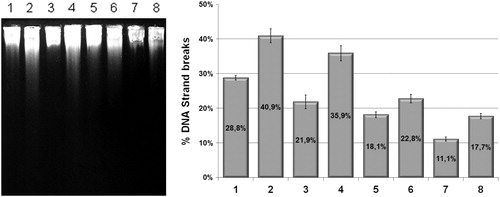
Figure 3. Mutagenesis RifR of E. coli wild strain (AB1157) (black column) and mutant fpg− (BH20) (gray column) irradiated with different doses of UVC in the presence (white mixed column), or absence of sodium azide. Values are the mean of at least five experiments (P < 0.001).
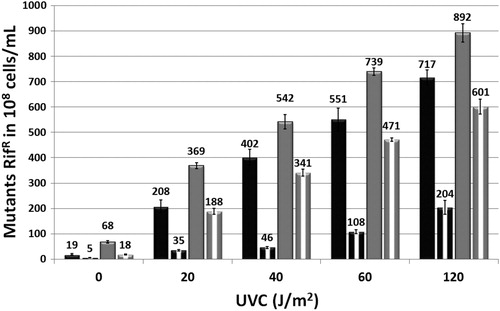
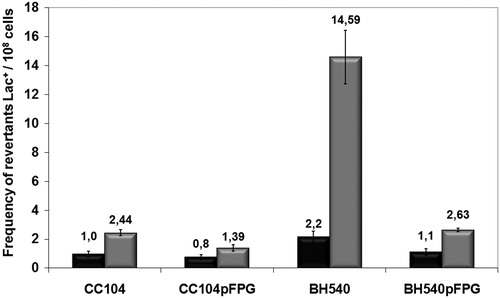
Figure 4. Mutagenesis LacZ of E. coli CC104, BH540, CC104 + pFPG, and BH540 + pFPG irradiated with 120 J/m2 UVC (gray column) or not irradiated (gray column). Values are the mean of at least five experiments and standard deviations were calculated (P < 0.001).