Figures & data
Figure 1. Agarose gel electrophoresis of plasmid DNA (pUC18, 394 µg/ml) incubated for 1 hour at 37oC with aqueous (A) or hydroalcoholic (B) extracts of S. uncinata (lanes 2–4). Lane 1 represents the negative control. Stannous chloride at 200 µg/ml was used as a positive control (lane 5). The direction of electrophoresis is top to bottom. Supercoiled (I) and relaxed circular (II) plasmid DNA forms are indicated. The gels are representative of experiments with similar results.
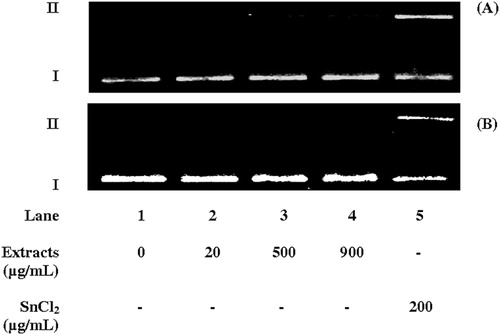
Figure 2. Agarose gel electrophoresis of plasmid DNA (pUC18, 394 μg/ml) incubated for 1 hour at 37oC with aqueous and hydroalcoholic extracts of S. uncinata at 900 µg/ml in the presence and absence of ROS generation systems: (A) Pyrogalol 250 µM for O2•−, (B) Fe2+/H2O2 (200 µM, 50 mM) for •OH, via Fenton reaction, (C) Cu2+/H2O2 (200 µM, 50 mM) for •OH and O2−•, via Fenton-like reaction, (D) SnCl2 (200 µg/ml) for •OH and O2−•, via in situ Fenton-like reaction. ROS inhibitors: DMSO 5%, except for SnCl2 in which EDTA 25 mM was used. The direction of electrophoresis is top to bottom. Supercoiled (I), relaxed circular (II), and linear (III) forms are indicated. The gels are representative of experiments with similar results.
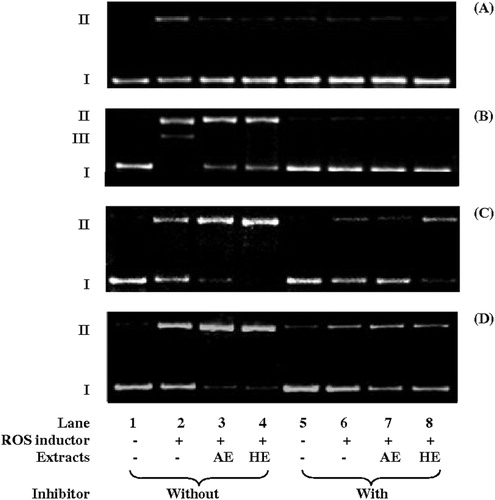
Table 1. Intensity (%, mean relative to total band density and standard deviation) of form II DNA (plasmid pUC18) treated with the aqueous (AE) and hydroalcoholic (HE) extracts of S. uncinata in the absence (–) or presence (+) of ROS generation systems and without (wo) or with (w) ROS inhibitors
Figure 3. Agarose gel electrophoresis of plasmid DNA (pUC18, 394 µg/ml) incubated for 1 hour at 37oC with aqueous (A) and hydroalcoholic (B) extracts of S. uncinata at 900 µg/ml in the presence of SnCl2 (200 µg/ml) with ROS scavengers or antioxidants: l-histidine 50 mM (his), DMSO 5%, NaN3 100 mM, BHT 20 mM, and sodium benzoate 2 M (benz). The direction of electrophoresis is from top to bottom. Supercoiled (I) and relaxed circular (II) forms are indicated. The gels are representative of experiments with similar results.
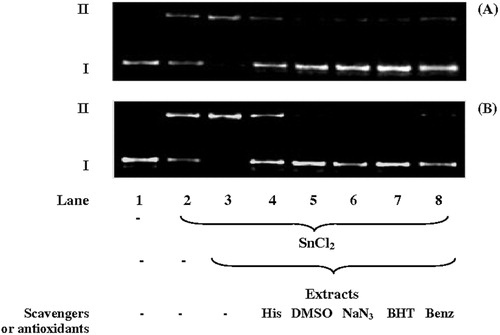
Table 2. Intensity (%, mean relative to total band density and standard deviation) of form II DNA (plasmid pUC18) treated with the aqueous (AE) and hydroalcoholic (HE) extracts of S. uncinata in the absence (wo) or presence (w) of SnCl2 and without (–) or with (+) ROS scavengers and antioxidants