Figures & data
Table 1. Clinical history of autistic and normal children taken for the study
Figure 1. Level of 4-HNE in the urine of autistic children compared with age and sex-matched normal children. Results were expressed as mean ± SD. *P < 0.001 (control vs. LFA, MFA, and HFA).
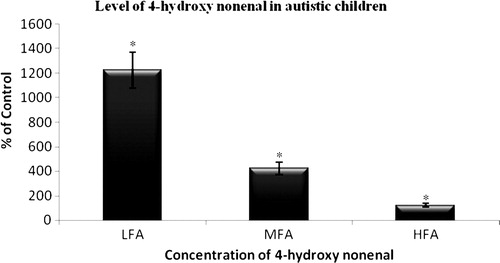
Table 2. Level of lipid peroxides, lipid hydroperoxides, and PC in the urine of autistic children compared with age- and sex-matched normal children
Table 3. Level of protein sulfhydryl, non-protein sulfhydryl, and total sulfhydryl groups in the urine of autistic children compared with age- and sex-matched normal children
Table 4. Level of TAC, total peroxides, and OSI in the urine of autistic children compared with age- and sex-matched normal children
Table 5. Level of uric acid, creatinine, and UA/Cr ratio in the urine of autistic children compared with age- and sex-matched normal children
Table 6. Spearman rank correlation between parameters vs. CARS