Figures & data
Table 1. Clinical characteristics of the study population
Table 2. Values of antioxidant substances in blood from NP and controls
Figure 1. Box-whisker plot of protein carbonyl content in serum obtained from the control group (C) and the normal pregnant group (NP). Data represent the mean value ± standard error of the mean for 23 individuals. P > 0.05 for NP when compared with the C.
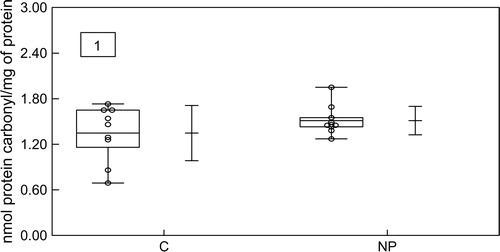
Figure 2. Box–Whisker plot of MDA content in serum obtained from the control group (C) and the normal pregnant group (NP). Data represent the mean value ± standard error of the mean for 27 individuals. **P < 0.01 for NP when compared with the C.

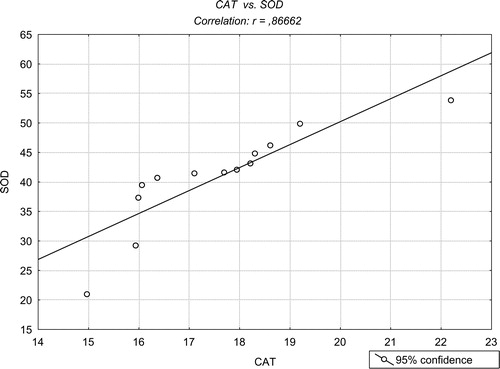
Figure 3. Pearson's correlation between SOD and CAT in citrated whole blood (P < 0.05).