Figures & data
Figure 1. Effect of PPC-Pr on gamma radiation-induced DNA damage on human blood leukocytes, estimated by comet aasay in terms of tail length (A), % DNA in tail (B), tail moment (C), olive tail moment (D). Column 1:0 Gy; 2: 4 Gy; 3; PPC-Pr 50 µg + 4 Gy; 4: PPC-Pr 100 µg + 4 Gy.
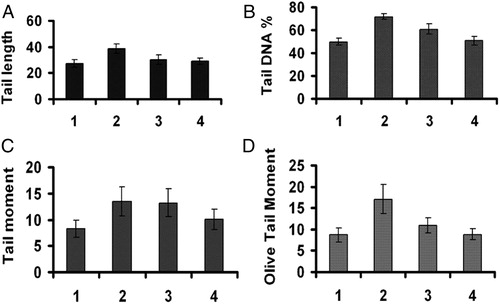
Figure 2. Effect of administration of PPC-Pr on tissue GSH levels of irradiated mice. Values are mean ± SD, n = 6, ***P < 0.001, *P < 0.05 compared to irradiated control (Bonferroni test); a, denotes P < 0.001 compared to normal (Bonferroni test).
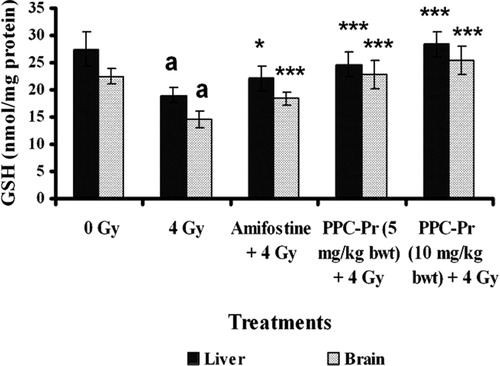
Figure 3. Effect of administration of PPC-Pr on GR activity in the serum of irradiated mice. Values are mean ± SD, n = 6, ***P < 0.001 compared to irradiated control; a, denotes P < 0.001 compared to normal (Bonferroni test).
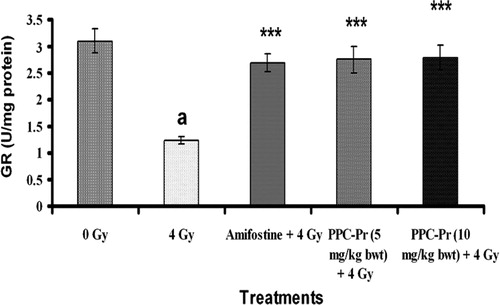
Table 1. Effect of administration of PPC-Pr on antioxidant enzyme activity in liver and brain tissues of irradiated mice (4 Gy)
Figure 4. Effect of administration of PPC-Pr on tissue MDA levels of irradiated mice. Values are mean ± SD, n = 6, ***P < 0.001; ns, non significant compared to irradiated control; a, denotes P < 0.001 compared to normal (Bonferroni test).
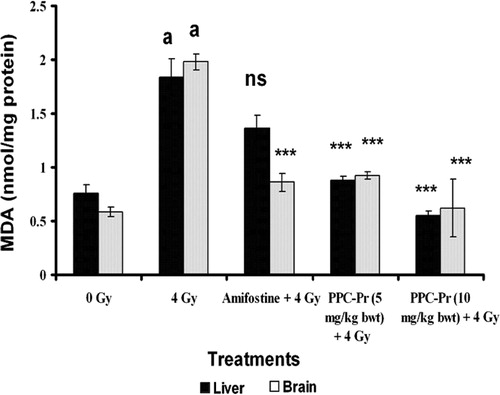
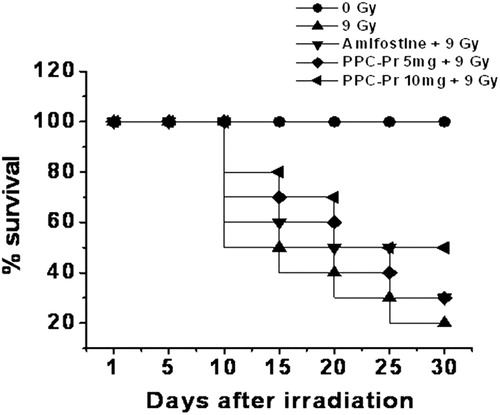
Figure 5. Effect of administration of PPC-Pr on survival rate of animals exposed to 9 Gy gamma radiation.