Figures & data
Figure 1. Structure of morin.
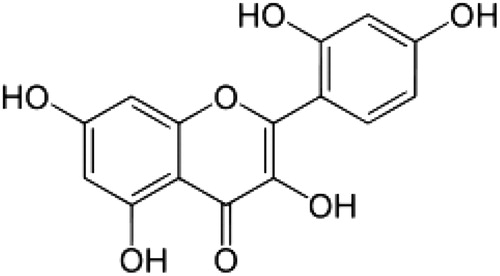
Figure 2. Effect of morin on the levels of TBARS and HP in the heart mitochondrial of control and ischemic rats. Values are expressed as means ± SD for eight rats in each group. Values not sharing a common superscript in a column differ significantly at P < 0.05 (DMRT).
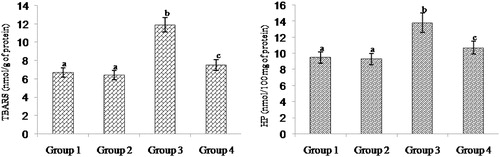
Figure 3. Effect of morin on the levels of SOD, CAT, GPx, GST, GR, and GSH in the heart mitochondrial of control and ischemic rats. Values are expressed as means ± SD for eight rats in each group. Values not sharing a common superscript (a–c) in a column differ significantly at P < 0.05 (DMRT). †CDNB: 1-chloro-2,4-dinitrobenzene. ‡One units is defined as the enzyme concentration required to inhibit the OD at 560 nm of chromogen production by 50% in 1 minute.
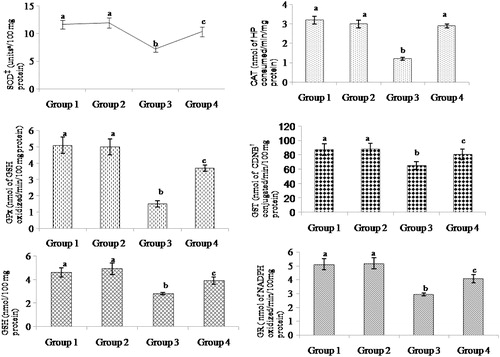
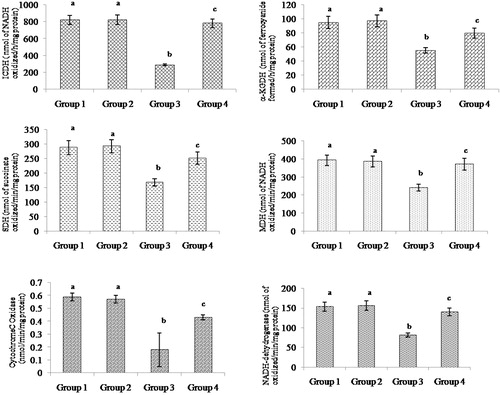
Figure 4. Effect of morin on the levels of ICDH, alpha-KGDH, SDH, MDH, cytochrome-C oxidase, and NADH-dehydrogenase in the heart mitochondrial of control and ischemic rats. Values are expressed as means ± SD for eight rats in each group. Values not sharing a common superscript in a column differ significantly at P < 0.05 (DMRT).