Figures & data
Figure 1. Reducing power versus concentration of polyphenols in the aqueous extract of Halimeda opuntia. Results expressed as mean ± standard deviation.
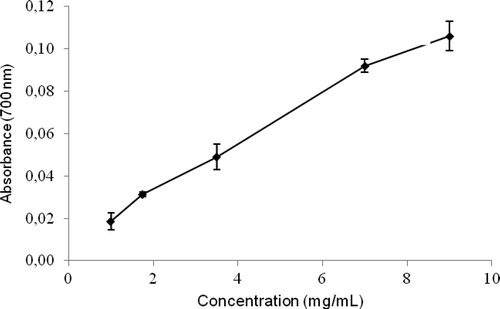
Table 1. Percentage inhibition of DPPH versus concentration of the aqueous extract of Halimeda opuntia. Results expressed as mean ± standard deviation.
Figure 2. (A) Liver and (B) serum TBARS levels from control, CCl4-treated, GA-treated, and Halimeda opuntia-treated rats. Different letters indicate statistically significant differences, P < 0.05.
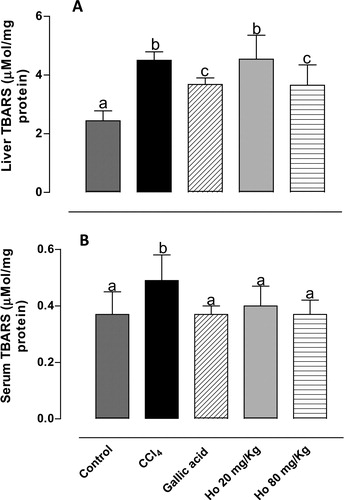
Figure 3. Activity of (A) SOD, (B) CAT, and (C) GPx in liver tissues from control, CCl4-treated, GA-treated, and Halimeda opuntia-treated rats. Different letters indicate statistically significant differences, P < 0.05.
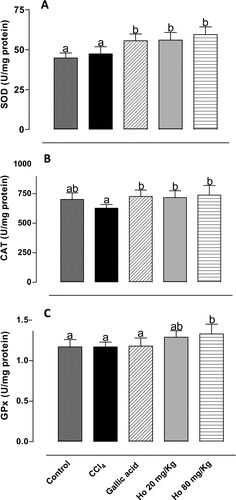
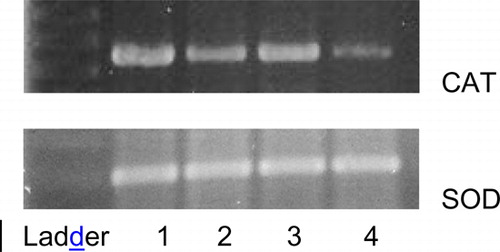
Figure 4. RT-PCR analysis of CAT and SOD expression in liver tissues on agarose gel: (1) control; (2) Halimeda opuntia 80 mg/kg, (3) GA, and (4) CCl4.