Figures & data
Table 1. E. coli K-12 bacterial strains and plasmids used in this work
Figure 1. Survival fraction of E. coli Δfur mutant QC1732 (squares), wild-type GC4468 (diamonds) and wild-type pretreated with dipyridyl 1 mM, a Fe2+ chelator (circles) irradiated with different doses of UVC (254 nm). Values are the mean of at least five experiments and were submitted to ANOVA test followed Tukey's comparison test (P > 0.05).
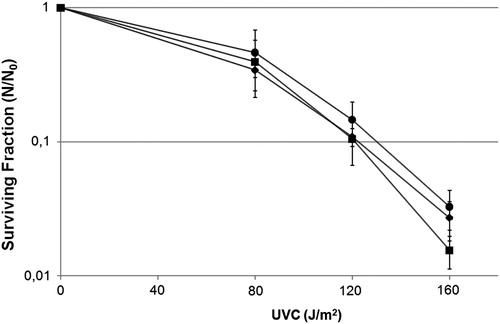
Figure 2. Survival fraction of E. coli wild-type CC104 (diamonds), mutM− mutant BH540 (squares), mutY− mutant BH980 (triangles), mutM− mutY− mutant BH990 (circles) original strains (filled symbols), or transformed with pFPG plasmid (open symbols) irradiated with different doses of UVC (254 nm). Values are the mean of at least five experiments and were submitted to ANOVA test followed Tukey's comparison test (P > 0.05, wild strain compared with mutY− mutant or mutM− mutY− mutant; P < 0.001 for all other comparisons).
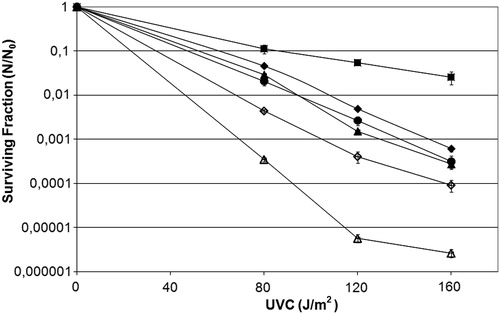
Figure 3. Mutagenesis LacZ of E. coli wild-type CC104, mutM− mutant BH540 and mutY− mutant BH980 not treated (black column) or irradiated with 120 J/m2 of UVC (254 nm) (gray column). Values are the mean of at least five experiments and were submitted to ANOVA test followed Tukey's comparison test (P < 0.001).
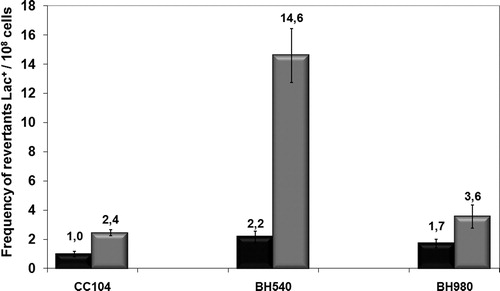
Figure 4. Survival fraction of E. coli uvrA− mutant AB1886 (diamonds), uvrA− mutM− mutant RJF624 (squares) original strains (filled symbols), or transformed with pFPG plasmid (open symbols) irradiated with different doses of UVC (254 nm). Values are the mean of at least five experiments and were submitted to ANOVA test followed Tukey's comparison test (P > 0.05, uvrA− mutant compared with uvrA− mutM− mutant transformed with pFPG plasmid; P < 0.001 for all other comparisons).
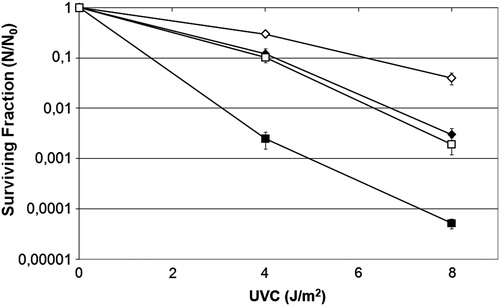
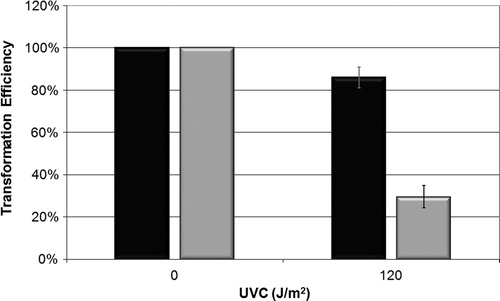
Figure 5. Efficiency of bacterial transformation with plasmid pUC 9.1 on strains AB1157 (black) and BH20 (gray) irradiated with 120 J/m2 of UVC. Values are the mean of at least five experiments and were submitted to chi square, adopting 5% as the significance level (P < 0.001).