Figures & data
Table 1. Activities of ALT, AST, and GGT in serum after 90 days of ethanol feeding
Figure 1. Schematic representation of experimental design.
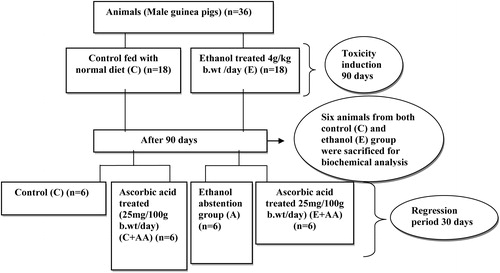
Table 2. Toxicity markers
Figure 2. Graphical representation of reduced GSH content in liver. Values are expressed as mean ± SEM of six guinea pigs in each group. Values not sharing a common superscript differ significantly at P < 0.05.
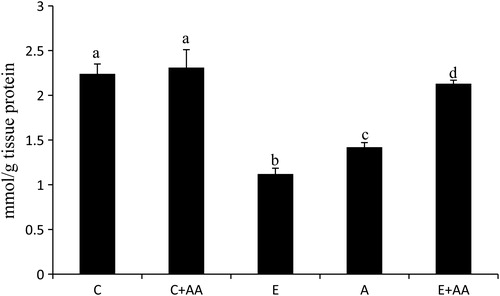
Table 3. Activity of GSH-dependent antioxidant enzymes in liver
Figure 3. (A) HPLC chromatogram of ascorbic acid in serum. (a) Control, (b) C+AA, (c) ethanol, (d) abstention, and (e) E+AA. The retention time was 2.2 minutes. (B) Graphical representation of ascorbic acid content in serum. Values are expressed as mean ± SEM of six guinea pigs in each group. Values not sharing a common superscript letter differ significantly at P < 0.05.
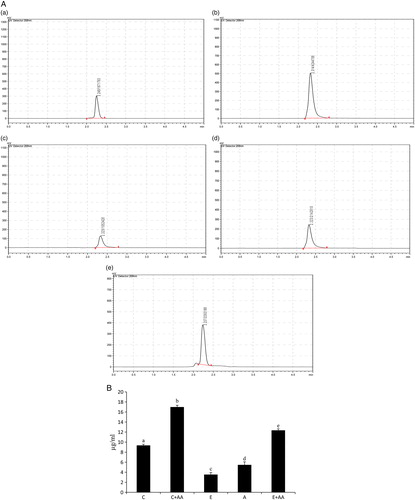
Figure 4. Graphical representation of TGs content in liver. Values are expressed as mean ± SEM of six guinea pigs in each group. Values not sharing a common superscript letter differ significantly at P < 0.05.
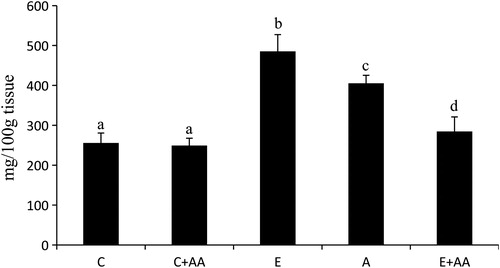
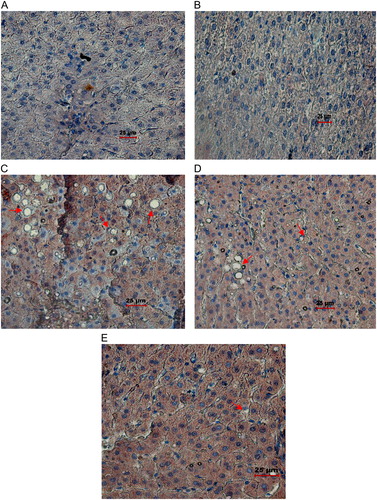
Figure 5. Histopathological#analysis of liver (magnification ×40). (A) Control liver tissue with normal hepatocyte architecture. (B) C+AA group liver tissue with normal hepatocyte architecture. (C) Ethanol group, showing altered hepatocyte architecture with vascular steatosis and inflammation. (D) Abstention group showing altered hepatocyte architecture with vascular steatosis and inflammation. (E) E+AA liver tissue showing nearly normal histological features with reduced amount of steatosis and inflammation.