Figures & data
Figure 1. Effect of morin on MAP (A), heart rate (B), and body weight (C) in UNX and DOCA-salt hypertensive rats. Values are expressed as means ± standard deviation (SD) for six rats in each group. Values not sharing a common superscript differ significantly at P < 0.05 (DMRT).
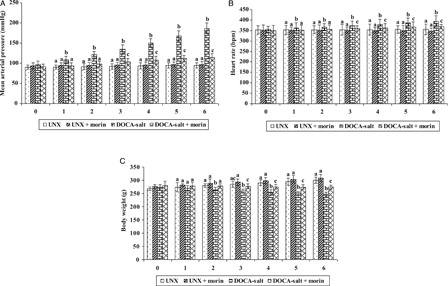
Table 1. Effect of morin on TC and TG in plasma and tissues of UNX and DOCA-salt hypertensive rats
Table 2. Effect of morin on FFA and PL in plasma and tissues of UNX and DOCA-salt hypertensive rats
Figure 2. Effect of morin on LDL-C, VLDL-C, and HDL-C in plasma of UNX and DOCA-salt hypertensive rats. Values are expressed as means ± SD for six rats in each group. Values not sharing a common superscript differ significantly at P < 0.05 (DMRT).
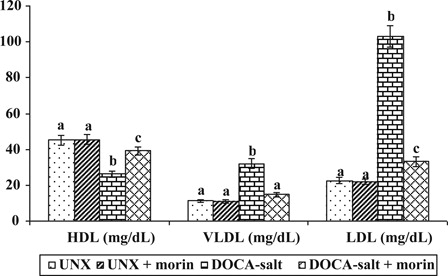
Figure 3. Effect of morin on the activity of HMG-CoA reductase in plasma and tissues of UNX and DOCA-salt hypertensive rats. Values are expressed as means ± SD for six rats in each group. Values not sharing a common superscript differ significantly at P < 0.05 (DMRT). *Lower ratio indicates higher enzyme activity.
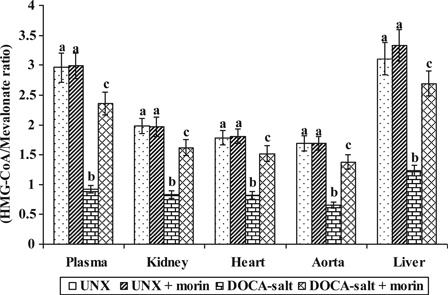
Figure 4. Effect of morin on the activity of LCAT in plasma of UNX and DOCA-salt hypertensive rats. Values are expressed as means ± SD for six rats in each group. Values not sharing a common superscript differ significantly at P < 0.05 (DMRT).
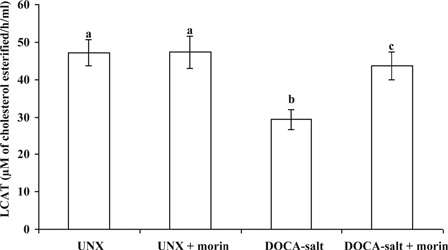
Figure 5. Effect of morin on the levels of urinary protein in UNX and DOCA-salt hypertensive rats. Values are expressed as means ± SD for six rats in each group. Values not sharing a common superscript differ significantly at P < 0.05 (DMRT).
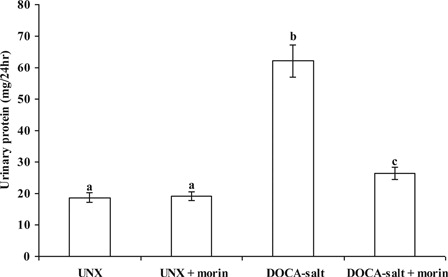
Figure 6. Photomicrograph of liver section staining with H & E (A–F; 10×) and MT (G–L; 10×). UNX-control (A and G), UNX-control treated with morin alone (50 mg/kg) (B and H), DOCA-salt hypertensive rats (C–E and I–K) and DOCA-salt rats treated with morin (50 mg/kg) (F and L). Scale bar: 5 µm.
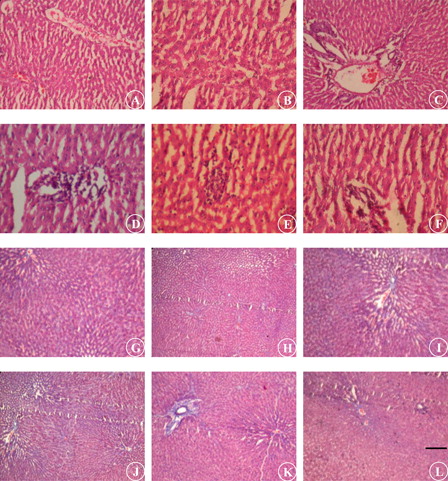
Table 3. Effect of morin on the degree of histological changes of liver in UNX and DOCA-salt hypertensive rats