Figures & data
Figure 1. Antioxidant enzymes activities in control and EG. Enzyme activity for GPx is expressed as U/g hemoglobin and for SOD as % inhibition rate. aSignificantly different from Day 0, P < 0.05. bSignificantly different between groups, P < 0.05. Data are expressed as mean ± SD. GPx, glutathione peroxidase; SOD, superoxide dismutase.
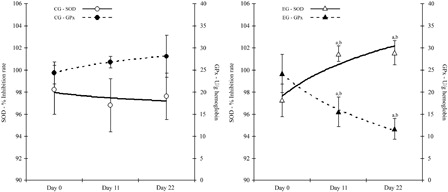
Table 1. TAC and urine MDA concentration in CG and EG
Table 2. Food consumption, water intake, urine output, and fecal weight in the CG and EG during the experimental period (Days 0–21)
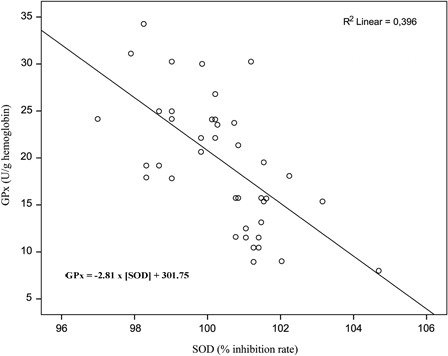
Figure 2. Relationship between SOD and GPx activity in the EG. The SOD activity accounts for almost 40% of the variability in GPx activity (and vice versa).