Publication Cover
Redox Report
Communications in Free Radical Research
Volume 17, 2012 - Issue 5
561
Views
8
CrossRef citations to date
0
Altmetric
Research articles

Different oxidative stress marker levels in blood from the operated knee or the antecubital vein in patients undergoing knee surgery: A tourniquet-induced ischemia–reperfusion model

, , , , &
Pages 194-199 | Published online: 19 Jul 2013

Figures & data

Table 1. Demographic and physical data

Figure 1. Time course of oxidized glutathione (GSSG) blood levels in patients undergoing total knee replacement. Values expressed as mean ± SD. Differences were analyzed with two-tailed tests for non-parametric data: Mann–Whitney U and Wilcoxon tests. P values of <0.05 were considered statistically significant. Patients were divided into two groups: group K, n = 17 (blood collected from a drainage tube placed in the operated knee), and group V, n = 15 (blood collected from a antecubital vein). Time course study: before surgery (T0) and after tourniquet deflation at different times: 3, 10, and 60 minutes (T1, T2, and T3, respectively). Statistical differences were observed in the same group (T0 vs. T1 or T2 or T3): *P < 0.05; **P < 0.01; ***P < 0.001. Statistical differences were observed between both groups (K vs. R): P < 0.05; ††P < 0.01; †††P < 0.001.

Figure 1. Time course of oxidized glutathione (GSSG) blood levels in patients undergoing total knee replacement. Values expressed as mean ± SD. Differences were analyzed with two-tailed tests for non-parametric data: Mann–Whitney U and Wilcoxon tests. P values of <0.05 were considered statistically significant. Patients were divided into two groups: group K, n = 17 (blood collected from a drainage tube placed in the operated knee), and group V, n = 15 (blood collected from a antecubital vein). Time course study: before surgery (T0) and after tourniquet deflation at different times: 3, 10, and 60 minutes (T1, T2, and T3, respectively). Statistical differences were observed in the same group (T0 vs. T1 or T2 or T3): *P < 0.05; **P < 0.01; ***P < 0.001. Statistical differences were observed between both groups (K vs. R): †P < 0.05; ††P < 0.01; †††P < 0.001.

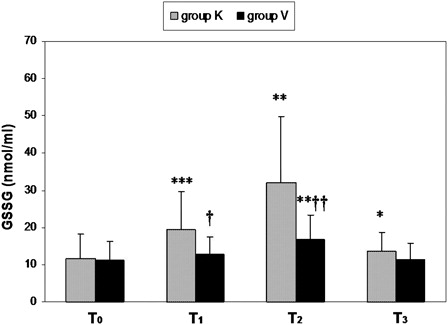
Table 2. Time course of glutathione oxidation and lipid peroxidation marker levels in blood in patients undergoing total knee replacement

Table 3. Time course of metabolic parameter and myoglobin in blood

Reprints and Corporate Permissions

Please note: Selecting permissions does not provide access to the full text of the article, please see our help page How do I view content?

To request a reprint or corporate permissions for this article, please click on the relevant link below:

Academic Permissions

Please note: Selecting permissions does not provide access to the full text of the article, please see our help page How do I view content?

Obtain permissions instantly via Rightslink by clicking on the button below:

If you are unable to obtain permissions via Rightslink, please complete and submit this Permissions form. For more information, please visit our Permissions help page.