Figures & data
Figure 1. Histopathological analysis of ear tissue, H&E. Scale bars: 100 µm. (A) Control: normal histology of rat ear tissue with the absence of inflammatory infiltrate and edema. Basal layer and epidermal cell maturation preserved (1). (B) NiSO4 sensitized; contact dermatitis characteristics such as dermal edema (2), acanthotic Malpighian layer (3) and moderate lymphocytic infiltrate (4). (C) NiSO4 sensitized and treatment with free clobetasol; shortening of the cornea and thickness of the granulomatous layer (5), decrease of lymphocytic infiltrate (6), and Malpighian layer atrophy (7). (D) NiSO4 sensitized and daily treatment with nanostructured clobetasol; Malpighian layer (8), muscular (9) and fur atrophy (10). (E) NiSO4 sensitized and alternately treated with clobetasol (days 1, 3, and 5); Malpighian layer (8), muscular (9) and fur atrophy (10), desquamation of the cornea layer (11) and edema (2). (F) Nanoparticles treatment: absence of atrophy.
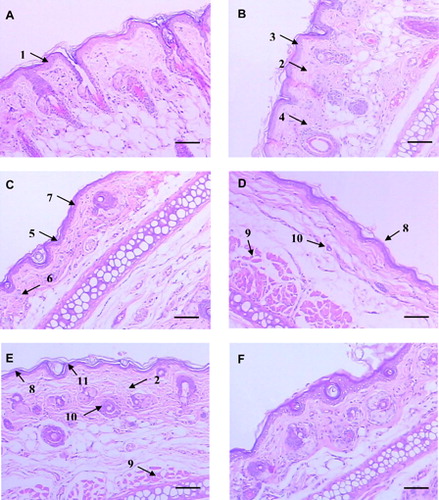
Figure 2. TBARS levels in livers from rats with NiSO4-induced contact dermatitis treated with free and nanostructured clobetasol. C, control group; CD, contact dermatitis; FC, CD treated with free clobetasol; NC, CD treated with nanostructured clobetasol; C135, CD treated with nanostructured clobetasol on days 1, 3, and 5; NP, empty nanoparticles. Bars represent mean ± SEM for eight animals in each group. ANOVA Newman–Keuls multiple comparison test. ***P < 0.001 compared with C, FC, NC, and C135.
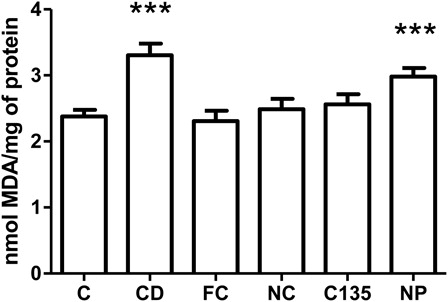
Figure 3. Carbonyl levels in livers from rats with NiSO4-induced contact dermatitis treated with free and nanostructured clobetasol. C, control group; CD, contact dermatitis; FC, CD treated with free clobetasol; NC, CD treated with nanostructured clobetasol; C135, CD treated with nanostructured clobetasol on days 1, 3, and 5; NP, empty nanoparticles. Bars represent mean ± SEM for eight animals in each group. ANOVA Newman–Keuls multiple comparison test.
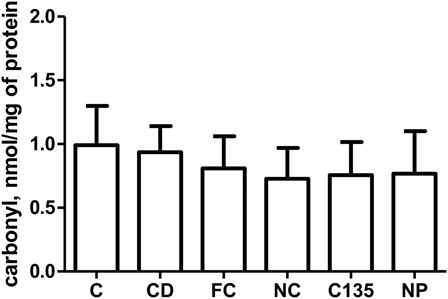
Figure 4. Non-protein sulfhydryl group levels in livers from rats with NiSO4-induced contact treated with free and nanostructured clobetasol. C, control group; CD, contact dermatitis; FC, CD treated with free clobetasol; NC, CD treated with nanostructured clobetasol; C135, CD treated with nanostructured clobetasol on days 1, 3, and 5; NP, empty nanoparticles. Bars represent mean ± SEM for eight animals in each group. ANOVA Newman—Keuls multiple comparison test. ***P < 0.001 compared with all the groups.
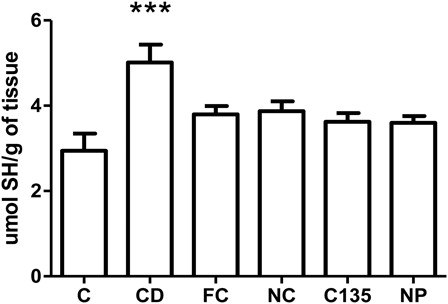
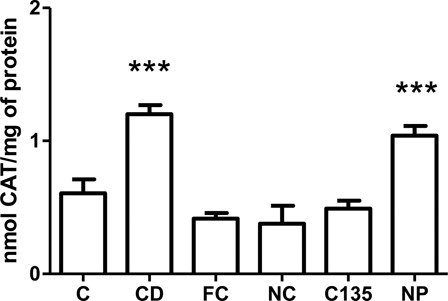
Figure 5. Catalase activity in livers from rats with NiSO4-induced contact dermatitis treated with free and nanostructured clobetasol. C, control group; CD, contact dermatitis; FC, CD treated with free clobetasol; NC, CD treated with nanostructured clobetasol; C135, CD treated with nanostructured clobetasol on days 1, 3, and 5; NP, empty nanoparticles. Bars represent mean ± SEM for eight animals in each group. ANOVA Newman–Keuls multiple comparison test. ***P < 0.001 compared with C, FC, NC, and C135.