Figures & data
Figure 1. Experimental model.
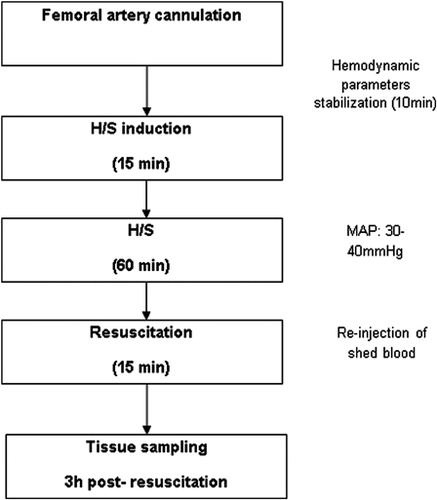
Figure 2. Production of organic hydroperoxides in the gut, liver, and lungs. Values expressed as mean ± SD. Sham, n = 8: rats were subjected to surgical artery cannulation alone. H/S, n = 8: rats were subjected to H/S. Clonidine, n = 8: rats pre-treated with clonidine were subjected to the surgical artery cannulation. Clonidine-H/S, rats pre-treated with clonidine were subjected to H/S. *P < 0.001 compared to sham, #P < 0.001 compared to H/S, ##P < 0.05 compared to H/S.
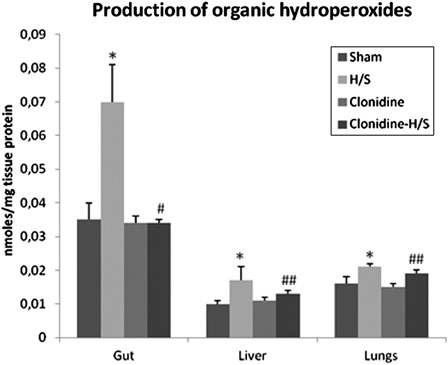
Figure 3. Production of superoxide radical in the gut, liver, and lungs (values expressed as mean ± SD). Sham, n = 8: rats were subjected to surgical artery cannulation alone. H/S, n = 8: rats were subjected to H/S. Clonidine, n = 8: rats pre-treated with clonidine were subjected to the surgical artery cannulation. Clonidine-H/S, rats pre-treated with clonidine were subjected to H/S. *P < 0.001 compared to sham, **P < 0.05 compared to sham, #P < 0.001 compared to H/S, ##P < 0.05 compared to H/S.
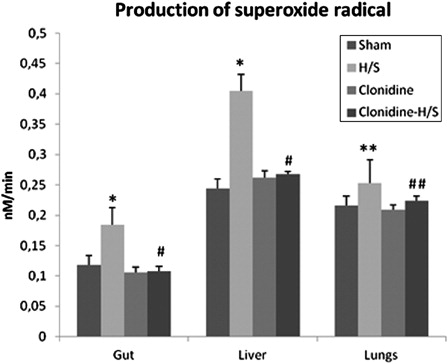
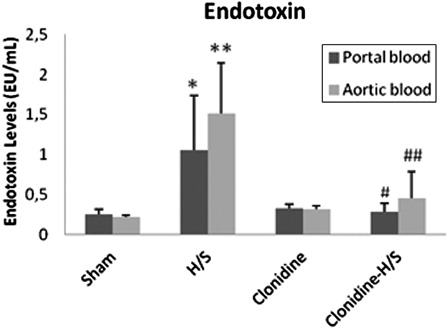
Figure 4. Endotoxin levels in portal and aortic blood samples (values expressed as mean ± SD). Sham, n = 8: rats were subjected to surgical artery cannulation alone. H/S, n = 8: rats were subjected to H/S. Clonidine, n = 8: rats pre-treated with clonidine were subjected to the surgical artery cannulation. Clonidine-H/S, rats pre-treated with clonidine were subjected to H/S. *P < 0.05 compared to sham, **P < 0.001 compared to sham, #P < 0.05 compared to H/S, ##P < 0.01 compared to H/S.