Figures & data
Table 1. Soluble sugar and starch accumulation (μg.cm−2) in the second pair of sunflower leaves
Figure 1. Effects of sugar treatment on ΦPSII. ΦPSII was measured at the base (A) and tip (B) of sunflower healthy leaves incubated for 4 days with either water (C) or 200 mM sugar solutions: glucose (Gluc), sucrose (Suc) or sorbitol (Sor). Results are expressed as mean ± SE of four independent experiments.
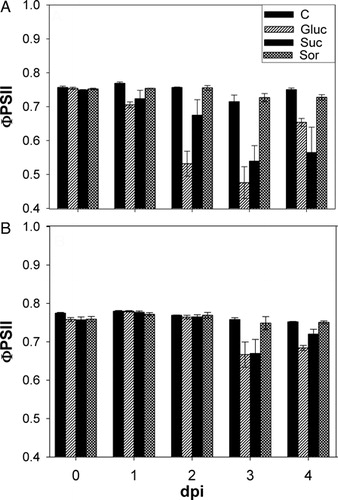
Figure 2. Photosynthesis-related gene expression from leaves incubated for 24 hours with either water or 200 mM sugar solutions: glucose (Gluc), sucrose (Suc) and sorbitol (Sor). Values were normalized based on those obtained from leaves incubated with water and actin as internal reference gene. Means of three independent biological experiments ± SE are shown. Significant differences were calculated by Student's t-test. *Significance at the 0.05 level of confidence.
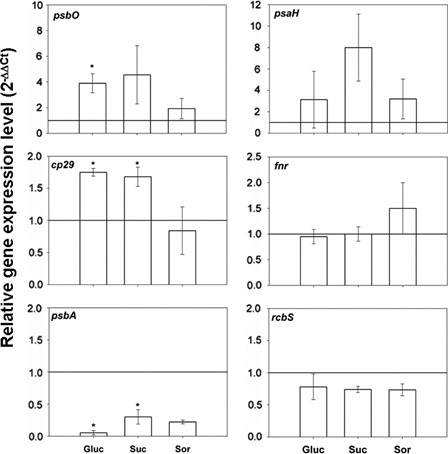
Figure 3. Hydrogen peroxide accumulation in the second pair of leaves incubated for 24 hours with either water (C) or 200 mM sugar solutions: glucose (Gluc), sucrose (Suc) and sorbitol (Sor). Results are expressed as means ± SE of 12 plants in three independent experiments. Different letters indicate significant differences from controls (P < 0.05, DGC).
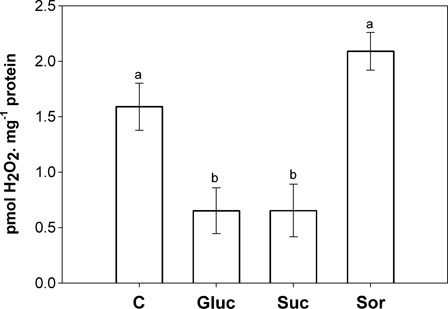
Figure 4. Effect of sugar treatment on glutathione and ascorbate content in the second pair of leaves incubated for 24 hours with either water (C) or 200 mM sugar solutions: glucose (Gluc), sucrose (Suc) and sorbitol (Sor). (A) Reduced glutathione (GSH grey bars) and oxidized glutathione (GSSG black bars). (B) GSH. (GSH+ GSSG)−1 ratio. (C) Reduced ascorbate (grey bars) and oxidized ascorbate (black bars). (D) ascorbate. (total ascorbate)−1 ratio. Results are means from 12 plants ± SE of four independent experiments. Different letters indicate significant differences from controls (P < 0.05, DGC).
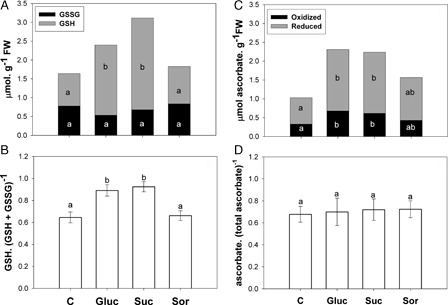
Figure 5. (A) NAD+ and NADH content in the second pair of leaves incubated for 24 hours with either water (C) or 200 mM sugar solutions: glucose (Gluc), sucrose (Suc) and sorbitol (Sor). NAD+ (black bars) and NADH (grey bars). (B) NADH. (NADH+ NAD+)−1 ratio. Results are means from 12 plants ± SE of four independent experiments. Different letters indicate significant differences from controls (P < 0.05, DGC).
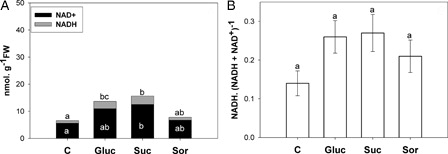
Figure 6. (A) NADP+ and NADPH content in the second pair of leaves incubated for 24 hours with either water (C) or 200 mM sugar solutions: glucose (Gluc), sucrose (Suc) and sorbitol (Sor). NADP+ (black bars) and NADPH (grey bars). (B) NADPH. (NADPH+ NADP+)−1 ratio. Results are means from 12 plants ± SE of four independent experiments. Different letters indicate significant differences from controls (P < 0.05, DGC).
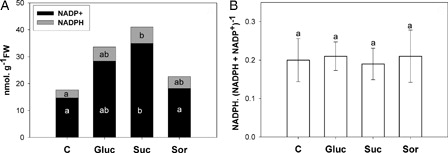
Figure 7. ATP content in the second pair of leaves incubated for 24 hours with either water (C) or 200 mM sugar solutions: glucose (Gluc), sucrose (Suc) and sorbitol (Sor). Results are means from 12 plants ± SE of four independent experiments. Different letters indicate significant differences from controls (P < 0.05, DGC).
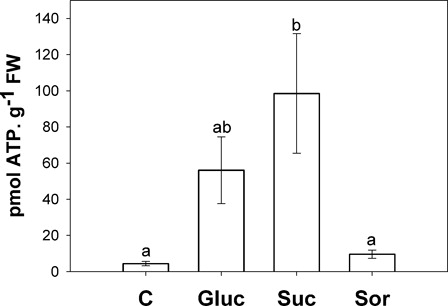
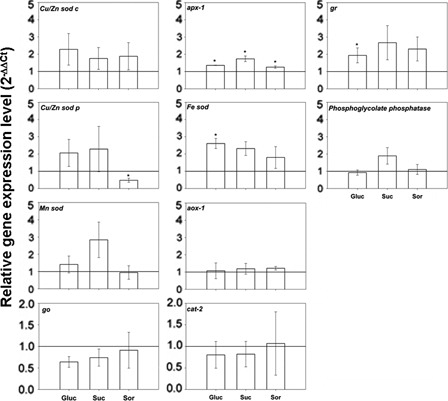
Figure 8. Antioxidant system gene expression from leaves incubated for 24 hours with either water or 200 mM sugar solutions: glucose (Gluc), sucrose (Suc) and sorbitol (Sor). Values were normalized based on data obtained from water and actin gene as internal reference. Means of three independent biological experiments ± SE are shown. Significant differences were calculated by Student's t-test. *Significance at the 0.05 levels of confidence.