Figures & data
Table 1. Primer sequences used for RT-PCR analysis
Table 2. Activity of toxicity marker enzymes in the liver and serum of rats
Table 3. Lipid peroxidation products, protein peroxidation products, total collagen, and hydroxyproline content in the liver
Table 4. Activities of scavenging enzymes Catalase, SOD, GPx, GR, and GSH in the liver of rats
Figure 1. mRNA expression of transcription factors. (A) Expression of NF kappa B. (B) Intensity of TNFalpha using gel doc. Expression of TNF-alpha was analyzed in the cytoplasmic fraction of liver by agarose gel electrophoresis and the intensities of the bands were compared with that of the intensities of GAPDH bands expressed in the samples. Intensities of the bands were quantified using Bio-Rad gel doc and plotted. The results presented are average of quadruplicate experiments ± SEM statistically significant at P < 0.05. (C) Intensity of CYP2E1 using gel doc. Expression of CYP2E1 was analyzed in the cytoplasmic fraction of liver by agarose gel electrophoresis and the intensities of the bands were compared with that of the intensities of GAPDH bands expressed in the samples. Intensities of the bands were quantified using Bio-Rad gel doc and plotted. The results presented are average of quadruplicate experiments ± SEM statistically significant at P < 0.05. (D) Intensity of TGF beta1 using gel doc. Expression of TGF beta1 was analyzed in the cytoplasmic fraction of liver by agarose gel electrophoresis and the intensities of the bands were compared with that of the intensities of GAPDH bands expressed in the samples. Intensities of the bands were quantified using Bio-Rad gel doc and plotted. The results presented are average of quadruplicate experiments ± SEM statistically significant at P < 0.05. (E) Intensity of collagen type I using gel doc. Expression of collagen was analyzed in the cytoplasmic fraction of liver by agarose gel electrophoresis and the intensities of the bands were compared with that of the intensities of GAPDH bands expressed in the samples. Intensities of the bands were quantified using Bio-Rad gel doc and plotted. The results presented are average of quadruplicate experiments ± SEM statistically significant at P < 0.05.
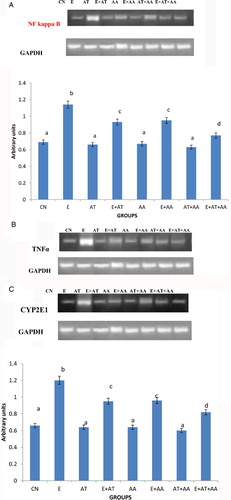
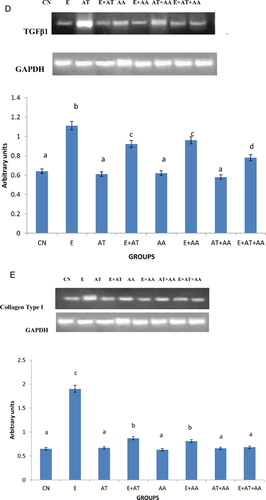
Figure 2. Graphical representation of alpha-tocopherol content in serum of CN, E, AT, E + AT, AA, E + AA, AT + AA, and E + AT + AA groups. Values are expressed as mean ± SEM of six rats in each group. Values not sharing a common superscript letter differ significantly at P < 0.05.
Figure 3. Graphical representation of ascorbic acid content in serum of CN, E, AT, E + AT, AA, E + AA, AT + AA and E + AT + AA groups. Values are expressed as mean ± SEM of six rats in each group. Values not sharing a common superscript letter differ significantly at P < 0.05.
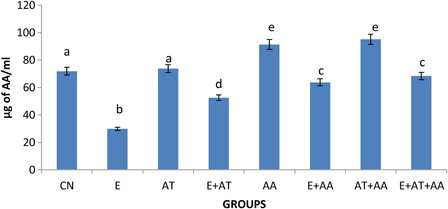
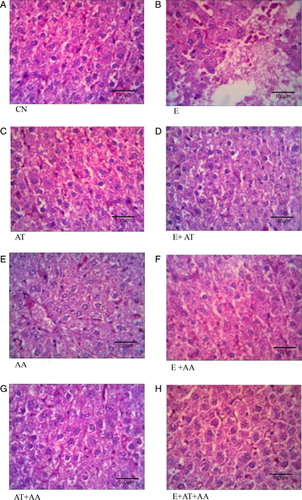
Figure 4. Histopathological analysis of liver (magnification 40×). (A) Control group showed normal liver architecture and cell structure. (B) Ethanol group showed extensive hepatocellular damage as evidenced by steatosis, vacuolization, and dilation of sinusoids. (C) AT group exhibited normal cell architecture as almost that of control. (D) E + AT group exhibited slight recovery from steatosis and inflammation. (E) AA group showed cells that were almost similar to the control. (F) E + AA group exhibited slight recovery from steatosis and inflammation. (G) AT + AA group showed cells almost similar to the control. (H) E + AT + AA group exhibited almost near normal cell architecture of CN group as evidenced by reduction in steatosis, vacuolization, dilation of sinusoids, and inflammation.