Figures & data
Table 1. Subject characteristics*
Figure 1. Oxidative stress and total antioxidant status of plasma increases in early type 2 diabetes patients. Plasma from type 2 diabetes patients at first clinical onset and from non-diabetes age-matched subjects was evaluated for Trolox equivalent antioxidant capacity (TEAC) (A) and malondialdehyde–thiobarbituric acid (MDA–TBA) adducts (B). Values are mean ± SE. *P < 0.01, #P < 0.001 vs. controls (analysis of variance Kruskal–Wallis test).
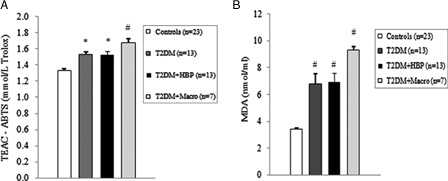
Figure 2. Oxidative stress and total antioxidant status of RBCs is increased in type 2 diabetes patients at first clinical onset. Red blood cells (RBCs) from early type 2 diabetes patients and from non-diabetes age-matched subjects were evaluated for TEAC (A) and MDA–TBA adducts (B). Values are mean ± SE. *P < 0.01, #P < 0.001 vs. controls (analysis of variance Kruskal–Wallis test). Hg, hemoglobin.
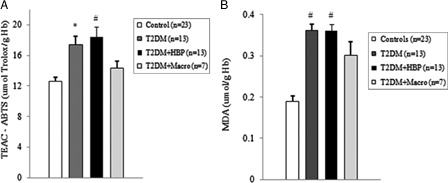
Figure 3. Antioxidant enzymatic activity is upregulated early in erythrocytes from type 2 diabetes patients. Superoxide dismutase (SOD) (A), catalase (CAT) (B), and glutathione peroxidase (GPX) (C) activity was measured in erythrocytes from type 2 diabetes patients at first clinical onset and from non-diabetes age-matched individuals. Values are mean ± SE. *P < 0.05, #P < 0.01 vs. controls (analysis of variance, one-way Tukey test).
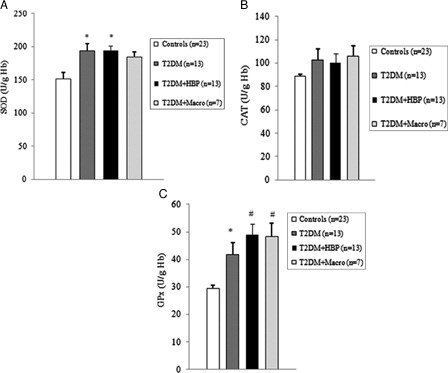
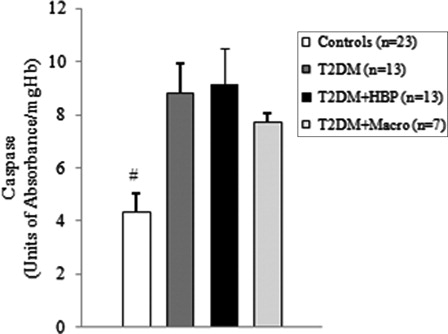
Figure 4. Caspase-3 is activated in RBCs of type 2 diabetes patients from first clinical onset. Caspase-3 activity was measured in RBCs from early type 2 diabetes patients and from non-diabetes age-matched subjects. Values are mean ± SE. #P < 0.05 vs. controls (analysis of variance Kruskal–Wallis test).