Figures & data
Figure 1. Chemical structure of stobadine (−)-cis-2,8-dimethyl-2,3,4,4a,5,9b-hexahydro-1H-pyrido[4,3b]indole (a) and SMe1EC2 (±)-cis-8-methoxy-2,3,4,4a,5,9b-hexahydro-1H-pyrido[4,3-b]indole-2-carboxylic acid ethyl ester (b).
![Figure 1. Chemical structure of stobadine (−)-cis-2,8-dimethyl-2,3,4,4a,5,9b-hexahydro-1H-pyrido[4,3b]indole (a) and SMe1EC2 (±)-cis-8-methoxy-2,3,4,4a,5,9b-hexahydro-1H-pyrido[4,3-b]indole-2-carboxylic acid ethyl ester (b).](/cms/asset/1b4a4cc6-25f4-43d4-881d-f4411dd299e3/yrer_a_11700784_f0001_b.jpg)
Figure 2. Continual absorbance decrease of ethanolic solution of DPPH radical (50 µM) in the presence of the antioxidant tested (50 µM) at λmax = 518 nm. The figure shows the typical records obtained from spectrophotometer working in a kinetic mode preset to 15-second scanning interval.
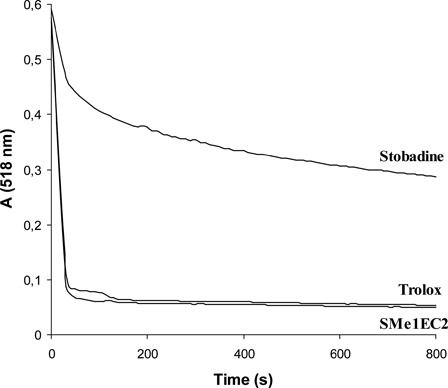
Figure 3. Typical hemolysis curves induced by (a) AAPH or (b) t-BuOOH. Erythrocyte suspensions (1.5%) were incubated (a) with 30 mM AAPH in the presence of 10 µM SMe1EC2 (-•-) or (b) with 250 µM tBuOOH in the presence of 2.5 µM SMe1EC2 (-•-). Control incubations, (-Δ-). Each value is the mean ± SD from three to six experiments.
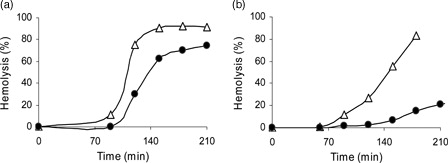
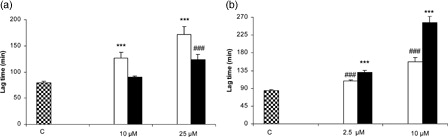
Figure 4. SMe1EC2 (▪) and stobadine (□) protect rat erythrocytes against (a) AAPH- or (b) t-BuOOH-induced hemolysis. Results are presented as means ± SD from three to six experiments. (a) ***P < 0.001 vs. (C) and (▪),###P < 0.001 vs. (C), parametric Student's t-test for independent samples; (b) ***P < 0.001 vs. (C) and (□), ###P < 0.001 vs. (C), parametric Student's t-test for independent samples.