Figures & data
Figure 1. Effect of DPV-Asn on ROS generation, spontaneous aggregation, cytotoxicity and apoptosis in human platelets. (A) Concentration-dependent (1–100 µM) effect of DPV-Asn on ROS generation assessed by DCFH-DA labelling in human platelets. Washed platelets pre-loaded with DCFH-DA and pre-treated with NAC (5 mM) or DPI (10 µM) for 5 minutes were stimulated with DPV-Asn (50 µM) for 15 minutes. (B) Aggregation profile of platelet-rich plasma stimulated with DPV-Asn (10–300 µM), H2O2 (4 mM, 8 mM) or collagen (1 µg/ml). In (A) and (B), data have been presented as the mean ± SEM of fold change in fluorescence intensity or percent aggregation response of five individual experiments. (C) LDH release was measured in control and DPV-Asn-treated platelets at various concentrations after 1 hour of incubation. (D) MTT toxicity assay was performed on washed platelets to ascertain DPV-Asn toxicity up to 100 µM. In (C) and (D) bar diagrams represent mean ± SEM of three independent experiments. (E) Platelets were incubated with various concentrations of DPV-Asn were labelled with Annexin V-FITC. (F) Mitochondrial membrane potential loss was monitored using the fluorescent probe JC-1. In (E) and (F), dot plots being represented from an individual experiment, which was performed at least three times. *P < 0.05, **P < 0.01, ***P < 0.001 significantly different from control, #P < 0.05 significantly different from DPV-Asn (50 µM)-treated platelets.
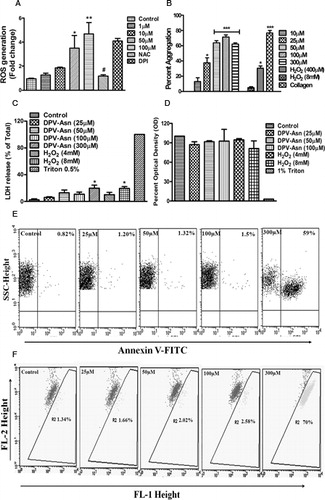
Figure 2. Effect of DPV-Asn on dense granule secretion, thromboxane A2 release, [Ca2+] influx and GPIIbIIIa activation. (A) ATP release from human platelets was assessed using luciferin–luciferase reaction after 10 minutes of incubation with DPV-Asn at various concentrations or platelets pre-treated with N-acetyl cysteine, NAC (5 mM), PLC inhibitor U73122 (1 µM) or BAPTA (10 µM) and stimulated with DPV-Asn (50 µM). (B) DPV-Asn induced release of TxB2 from platelets in a concentration-dependent manner. Levels of TxB2 were assayed in the supernatant of washed platelet suspension after 10 minutes of platelet stimulation. (C) DPV-Asn-induced calcium mobilization in human platelets. Platelet-rich plasma was loaded with Fura-2AM (5 µM) for 60 minutes at RT. Platelets were then washed and measurement of intracellular [Ca2+] was performed in 2 ml aliquots of platelet suspension under continuous stirring. Results being expressed as mean increase in intracellular [Ca2+] concentration (nM ± SEM). (D) Increase in platelet [Ca2+] levels upon DPV-Asn stimulation (50 µM) after pre-treatment with NAC (5 mM), U73122 (1 µM), EGTA (1 mM), or BAPTA (10 µM), followed by addition of 2 mM CaCl2 to detect the [Ca2+]. (E) DPV-Asn-induced platelet activation as assessed by the activation of GPIIbIIIa, which was monitored by PAC1-FITC labelling using flow cytometry. The representative overlay histograms have been presented as the number of events versus PAC-1 binding [(a) Control, (b) DPV-Asn (50 µM), (c) DPV-Asn (100 µM), (d) NAC + DPV-Asn (50 µM), (e) BAPTA + DPV-Asn (50 µM), (f) H2O2 (8 mM)] (F) Bar diagram represents the mean fold change in fluorescence intensity (MFI) relative to unstimulated platelets as shown in (E) from three separate experiments ± SEM. *P < 0.05, **P < 0.01, ***P < 0.001 significantly different from unstimulated control, #P < 0.05 significantly different from DPV-Asn (50 µM)-treated platelets.
![Figure 2. Effect of DPV-Asn on dense granule secretion, thromboxane A2 release, [Ca2+] influx and GPIIbIIIa activation. (A) ATP release from human platelets was assessed using luciferin–luciferase reaction after 10 minutes of incubation with DPV-Asn at various concentrations or platelets pre-treated with N-acetyl cysteine, NAC (5 mM), PLC inhibitor U73122 (1 µM) or BAPTA (10 µM) and stimulated with DPV-Asn (50 µM). (B) DPV-Asn induced release of TxB2 from platelets in a concentration-dependent manner. Levels of TxB2 were assayed in the supernatant of washed platelet suspension after 10 minutes of platelet stimulation. (C) DPV-Asn-induced calcium mobilization in human platelets. Platelet-rich plasma was loaded with Fura-2AM (5 µM) for 60 minutes at RT. Platelets were then washed and measurement of intracellular [Ca2+] was performed in 2 ml aliquots of platelet suspension under continuous stirring. Results being expressed as mean increase in intracellular [Ca2+] concentration (nM ± SEM). (D) Increase in platelet [Ca2+] levels upon DPV-Asn stimulation (50 µM) after pre-treatment with NAC (5 mM), U73122 (1 µM), EGTA (1 mM), or BAPTA (10 µM), followed by addition of 2 mM CaCl2 to detect the [Ca2+]. (E) DPV-Asn-induced platelet activation as assessed by the activation of GPIIbIIIa, which was monitored by PAC1-FITC labelling using flow cytometry. The representative overlay histograms have been presented as the number of events versus PAC-1 binding [(a) Control, (b) DPV-Asn (50 µM), (c) DPV-Asn (100 µM), (d) NAC + DPV-Asn (50 µM), (e) BAPTA + DPV-Asn (50 µM), (f) H2O2 (8 mM)] (F) Bar diagram represents the mean fold change in fluorescence intensity (MFI) relative to unstimulated platelets as shown in (E) from three separate experiments ± SEM. *P < 0.05, **P < 0.01, ***P < 0.001 significantly different from unstimulated control, #P < 0.05 significantly different from DPV-Asn (50 µM)-treated platelets.](/cms/asset/3c9e8454-d559-462c-9409-d704efe90417/yrer_a_11745390_f0002_b.jpg)
Figure 3. DPV-Asn-induced protein tyrosine phosphorylation in human platelets. (A) Washed platelets pre-incubated at 37°C with saline or 100 µM genistein for 5 minutes, were further incubated with different concentrations of DPV-Asn for 10 minutes. (B) Washed platelet incubated with DPV-Asn (50 µM) in the absence or presence of NAC (5 mM) or H2O2 (4 mM). Blot is representative of three independent experiments.
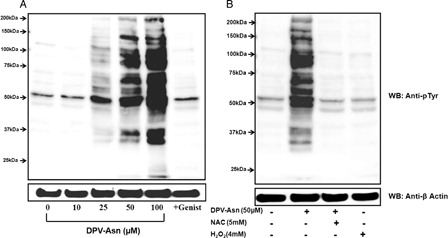
Figure 4. Effect of pharmacological interventions on DPV-Asn-induced platelet aggregation, thromboxane A2 release, PLC-γ2, and MAP kinase phosphorylation. (A) Platelet-rich plasma was incubated with inhibitors (NAC [5 mM], U73122 [1 µM], BAPTA [10 µM], SB203580 [10 µM], PD98059 [10 µM], aspirin [100 µM], for 5 minutes followed by stimulation with DPV-Asn (50 µM) at 37°C in an aggregometer under continuous stirring. Data being expressed as mean ± SEM of percent aggregation response from five independent experiments performed in duplicate for each data point. (B) DPV-Asn induced TxB2 release from human platelets. Levels of TXB2 were assayed in the supernatant of washed platelet suspension in presence or absence of inhibitors. (C, D) DPV-Asn-induced PLC-γ2 phosphorylation. PLC-γ2 was immunoprecipitated with anti-PLC-γ2 and immunoblotted with anti-phosphotyrosine after washed platelets were stimulated with DPV-Asn at various concentrations (25, 50, 100 µM) (C) or washed platelets pre-treated with NAC (5 mM) or U73122 (1 µM) followed by stimulation with DPV-Asn (50 µM) for 10 minutes (D). (E, F) DPV-Asn-induced phosphorylation of p38 and ERK1/2 MAP kinases. Washed platelets were incubated for 10 minutes with indicated inhibitors followed by stimulation with DPV-Asn at 37°C, and immunoblotted with phospho p38, p38, phospho ERK1/2, or ERK1/2 antibodies. All immunoblots in (C), (D), (E), and (F) are representative of three independent experiments under similar conditions. Upper panels represent the mean densitometric scans ± SEM of three experiments. *P < 0.05 significantly different from control, #P < 0.05, ##P < 0.01 significantly different from DPV-Asn (50 µM).
![Figure 4. Effect of pharmacological interventions on DPV-Asn-induced platelet aggregation, thromboxane A2 release, PLC-γ2, and MAP kinase phosphorylation. (A) Platelet-rich plasma was incubated with inhibitors (NAC [5 mM], U73122 [1 µM], BAPTA [10 µM], SB203580 [10 µM], PD98059 [10 µM], aspirin [100 µM], for 5 minutes followed by stimulation with DPV-Asn (50 µM) at 37°C in an aggregometer under continuous stirring. Data being expressed as mean ± SEM of percent aggregation response from five independent experiments performed in duplicate for each data point. (B) DPV-Asn induced TxB2 release from human platelets. Levels of TXB2 were assayed in the supernatant of washed platelet suspension in presence or absence of inhibitors. (C, D) DPV-Asn-induced PLC-γ2 phosphorylation. PLC-γ2 was immunoprecipitated with anti-PLC-γ2 and immunoblotted with anti-phosphotyrosine after washed platelets were stimulated with DPV-Asn at various concentrations (25, 50, 100 µM) (C) or washed platelets pre-treated with NAC (5 mM) or U73122 (1 µM) followed by stimulation with DPV-Asn (50 µM) for 10 minutes (D). (E, F) DPV-Asn-induced phosphorylation of p38 and ERK1/2 MAP kinases. Washed platelets were incubated for 10 minutes with indicated inhibitors followed by stimulation with DPV-Asn at 37°C, and immunoblotted with phospho p38, p38, phospho ERK1/2, or ERK1/2 antibodies. All immunoblots in (C), (D), (E), and (F) are representative of three independent experiments under similar conditions. Upper panels represent the mean densitometric scans ± SEM of three experiments. *P < 0.05 significantly different from control, #P < 0.05, ##P < 0.01 significantly different from DPV-Asn (50 µM).](/cms/asset/29427ce2-9976-4a19-8437-27c4feb2ad9a/yrer_a_11745390_f0004_b.jpg)
Figure 5. DPV-Asn-induced release of sCD40L is regulated by PLC-γ2 and thromboxane A2. (A) DPV-Asn, H2O2 (8 mM) or collagen (6 µg/ml)-induced release of soluble CD40L (sCD40L) from human washed platelets. The soluble CD40L (sCD40L) released from activated platelets in the presence of DPV-Asn, H2O2 or collagen was measured by enzyme-linked immunosorbent assay. (B) Effect of various pharmacologic interventions on DPV-Asn-induced sCD40L release from platelets (NAC (5 mM), aspirin (100 µM), U73122 (1 µM), SB203580 (10 µM), PD98059 (10 µM), eptifibatide (10 µM), SQ29548 (100 nM)). Data have been presented as mean ± SEM of amount of sCD40L released (pg/ml) of four independent experiments (*P < 0.05, **P < 0.01 vs. control platelets).
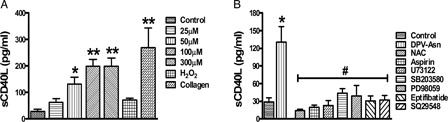
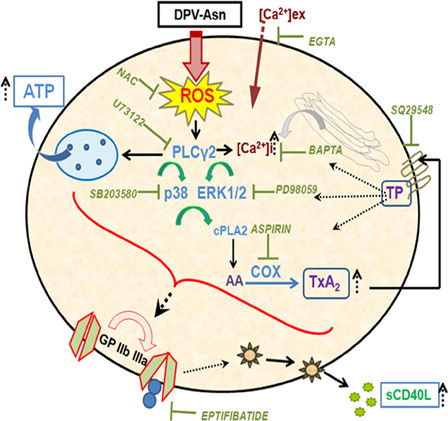
Figure 6. Schematic illustration of DPV-Asn-induced oxidative stress in platelets causing aggregation and sCD40L release. The model depicts that catalase-tolerant peroxide DPV-Asn mediates sequential induction of a signaling cascade in platelets, chiefly regulated by PLC-γ2, which apparently played a central role in upregulating dense granule secretion, calcium influx, p38 and ERK1/2 MAP kinase phosphorylation, and subsequently directed COX activation and enhanced TxA2 generation to further amplify platelet aggregation and thrombus formation. DPV-Asn further augments GPIIbIIIa-dependent release of proinflammatory cytokine sCD40L, thereby exhibiting a thrombo-inflammatory phenotype. DPV-Asn, diperoxovanadate-asparagine; ROS, reactive oxygen species; NAC, N-acetyl cysteine; AA, arachidonic acid; COX, cycloxygenase; TxA2, thromboxane A2; TP, thromboxane-prostanoid receptor.