Figures & data
Figure 1. Triglyceride accumulation in 3T3-L1 during adipogenic differentiation. NAC was added at day 0 and replaced every day for 10 days (DCN). The results are the average of four independent experiments (mean ± SD). *P < 0.01, MDI-treated cells (DCs) vs. control cells (CCs).
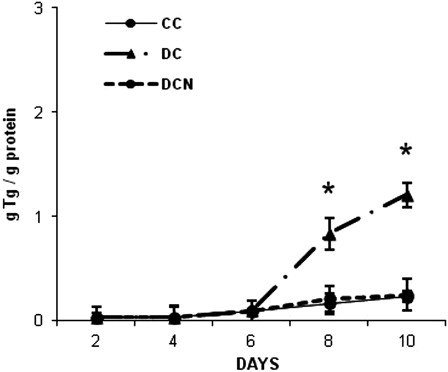
Figure 2. NAC effect on 3T3-L1 cells at day 10 of differentiation. (A) Control cells (CCs), (B) and (C) MDI-treated cells (DCs), (D) MDI + 10 µmol/l NAC-treated cells (DCN). Representative results from one of four independent experiments with similar results are shown.
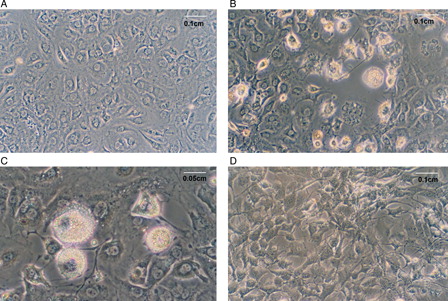
Figure 3. NAC effect on cell viability during adipogenic differentiation. Comparison of MDI cells (DCs) and MDI + 10 µmol/l NAC-treated cells (DCN). Cells were harvested at indicated times. (A) MTT assay was performed, control cells (CCs) absorbance was considered as 100%. (B) Cell were counted, and viable cells were evaluated by trypan blue stain exclusion, control cells (CCs) number was considered as 100%. Data are presented as percentages of control cells. The results are the average of four different experiments (mean ± SD).
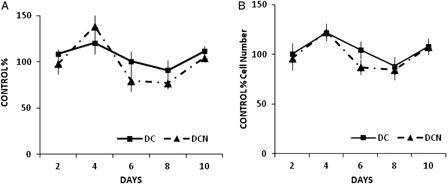
Figure 4. Concentration-dependent effect of NAC on cell viability. MDI cells were treated with 10 µmol/l NAC (DCN10), 20 µmol/l NAC (DCN20), 50 µmol/l NAC (DCN50) or 100 µmol/l NAC (DCN100). Control cells (CCa), MDI-treated cells (DC) and MDI–NAC-treated cells were harvested at day 10, and MTT assays were performed. The absorbance of vehicle-treated cells (CCs) was considered 100% cell viability. The results shown are the averages of four different experiments (mean ± SD).
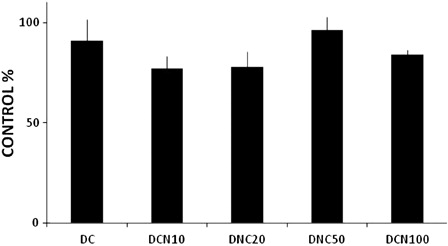
Figure 5. FABP4 expression during adipogenic differentiation. The values represent fold increases in protein expression compared to control cells (CCs). The bars shown are the averages of three different experiments (mean ± SD). Representative results from one of three independent western blot experiments with similar results are shown. Results are expressed as arbitrary units; *P < 0.01 MDI–NAC-treated cells (DCN) vs. CCs; *P < 0.01 MDI-treated cells (DC) vs. CCs.
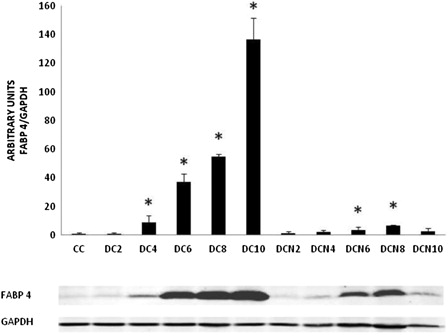
Figure 6. HSP70 (A) and MAOA expression (B) during adipogenic differentiation. The values represent fold increases in protein expression compared to control cells (CC). The bars shown are the averages of three different experiments (mean ± SD). Representative results from one of three independent western blot experiments with similar results are shown. Results are expressed as arbitrary units; *P < 0.01 MDI–NAC-treated cells (DCN) vs. MDI-treated cells (DC) at day 10.
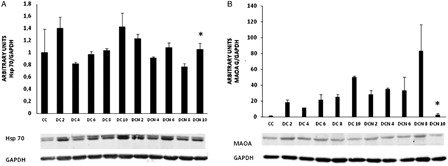
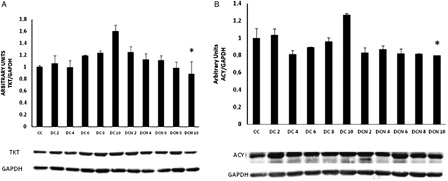
Figure 7. TKT (A) and ACY-1 expression (B) during adipogenic differentiation. The values represent fold increases in protein expression compared to control cells (CC). The bars shown are the averages of three different experiments (mean ± SD). Representative results from one of three independent western blot experiments with similar results are shown. Results are expressed as arbitrary units; *P < 0.01 MDI–NAC-treated cells (DCN) vs. MDI-treated cells (DC) at day 10.