Figures & data
Figure 1. UVA irradiation unit. A stirred quartz cuvette containing the sample is positioned in a black metal chamber having an opening only towards the site of UVA-illumination. The experiments were carried out in a darkened room at room temperature. The sample was irradiated by two UVA diodes (370 ± 15 nm) with 3.0 mW/cm2. Constant stirring of the mixture largely prevented an inhomogeneous distribution of RF in the cuvette. The sample can be purged on demand via a needle in the lid of the cuvette holder by air or by argon gas.
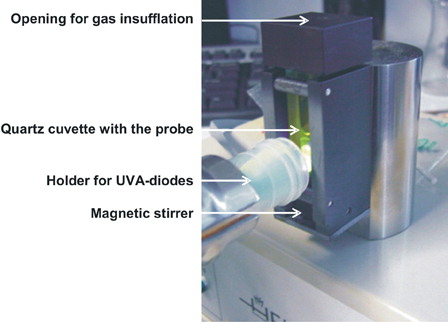
Figure 2. ESR spectra of the ·DMPO-OH adduct detected during UVA irradiation of RF. ESR spectra were recorded during UVA illumination of RF in the presence of DMPO dissolved in isotonic NaCl (4 mM RF and 0.1 M DMPO dissolved in 1 ml of 0.154 M NaCl (0.9%)). Fifty microliters of aliquots were taken from the RF solution before and during irradiation at different time points (for more clarity only spectra taken after the 10th, 30th and 60th minutes were displayed). The characteristic ESR spectrum of the ·DMPO-OH adduct (1:2:2:1) was measured in an ESR spectrometer at following spectrometer settings: center field 3370 G, sweep width 100 G (10 mT), sweep time 120 seconds, number 1, modulation amplitude 100 mG, power attenuation 6 dB, receiver gain 50. The second band of the ESR spectrum was used as a measure for the relative ESR signal intensity of the ·DMPO-OH adduct which is expressed in arbitrary units (a.u.).
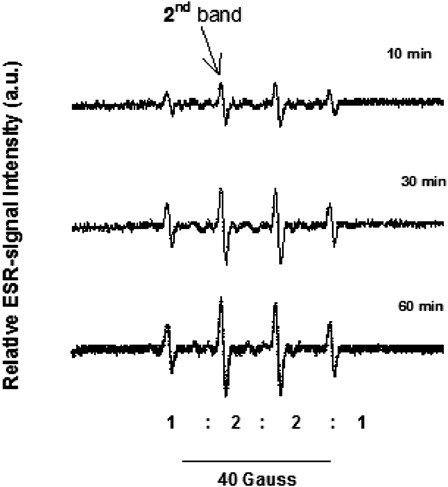
Figure 3. Relative ESR signal intensity of the ·DMPO-OH adduct in the presence of air or argon. RF solution (c was stirred vigorously under air (filled circles) or purged with argon gas for 15 minutes (open circles) thereafter UVA irradiation (3.0 mW/cm2) was started at room temperature. For recording the ESR spectrum, 50 µl of aliquots were taken from the RF solution before and during UVA irradiation (0, 1, 5, 10, 20, 30, 40, 50, 60, and 90 minutes). Each experiment was repeated independently five times. The intensity of the second band of the ·DMPO-OH adduct spectrum was determined and plotted against time. The results are expressed as mean of the relative ESR signal intensity and the error bars show the SEM.
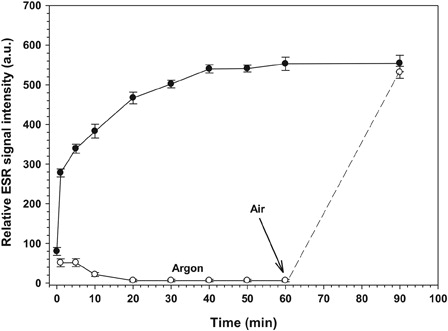
Figure 4. Influence of catalase on relative ESR signal intensity of the •DMPO-OH adduct. Sample composition and ESR settings correspond to those described in Fig. 3. Additionally, either 170 µg catalase (open circles) or 170 µg BSA (triangles) were added. The data for each group at each time point represent the mean of five experiments. Standard error is presented by error bars.
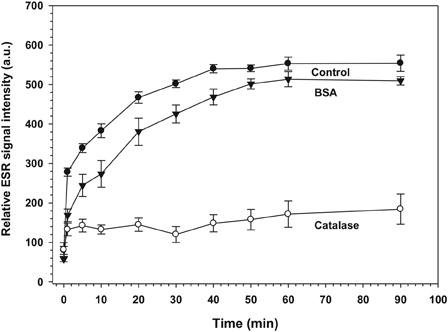
Figure 5. UVA irradiation of hydrogen peroxide in the absence of RF. DMPO (0.1 M) dissolved in 1 ml NaCl solution (0.9%) was irradiated by UVA-light in the presence (filled circles) or absence (open circles) of hydrogenperoxide (0.65 mM). UVA irradiation and sample preparation for ESR analysis as well as ESR spectrometer settings were according to Fig. 3. Each data point (filled circles) represents the mean value of five experiments of ESR signal intensity of the ·DMPO-OH adduct with error bars representing the SEM. In the experiments with the DMPO solution only (open circles), the ESR signal intensities were almost undetectable.
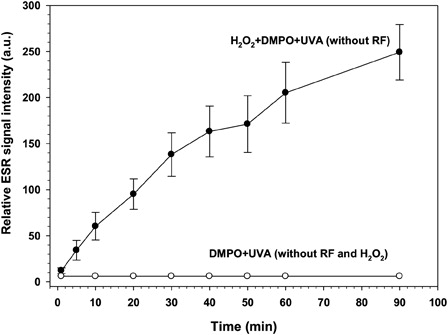
Figure 6. Effect on relative ESR signal intensity of ·DMPO-OH adduct after stopping the UVA irradiation of RF. The RF solution, sample collection at each time point as well as the UVA irradiation and ESR settings are described for the experiments in Fig. 3. UVA irradiation of the RF solution was stopped after 10 minutes.
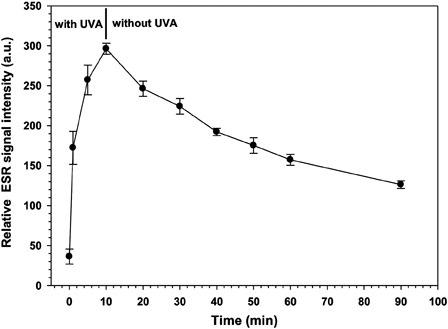
Figure 7. Effect on relative ESR signal intensity of ·DMPO-OH adduct after UVA irradiation of RF for 5 hours. RF solution (4.43 mM RF in 0.9 ml of 0.154 M NaCl (0.9%)) was irradiated with UVA (370 nm, 3.0 mW/cm2) for 5 hours. Thereafter 100 µl of 1 M DMPO was added as spin trap to the solution (open circles) and under continued UVA illumination 50 µl samples were taken for ESR analysis at different time points. For controls, RF solution (4 mM RF and 0.1 M DMPO dissolved in 1 ml of 0.154 M NaCl (0.9%)) (filled circles) was prepared shortly before starting the UVA irradiation (filled circles).
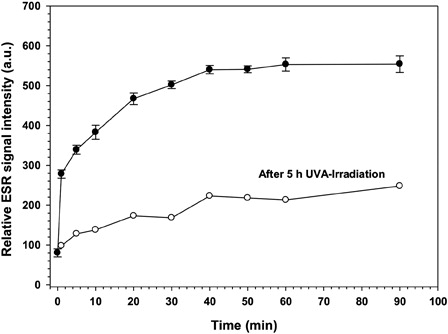
Figure 8. Influence of UVA irradiation on UV-VIS spectra of RF. One milliliter of RF solution (0.067 mM) in NaCl (0.154 M) was irradiated with UVA under continuous stirring in the presence of oxygen. The whole cuvette was relocated before and after 30, 60, and 90 minutes UVA irradiation to a spectrophotometer to record the spectrum between 200 and 550 nm. Thereafter the cuvette was relocated to the UVA irradiation unit. The absorbance is given in absorbance units (a.u.).
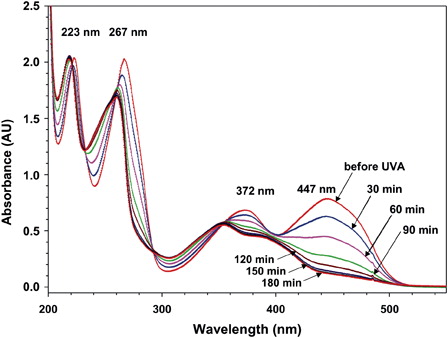
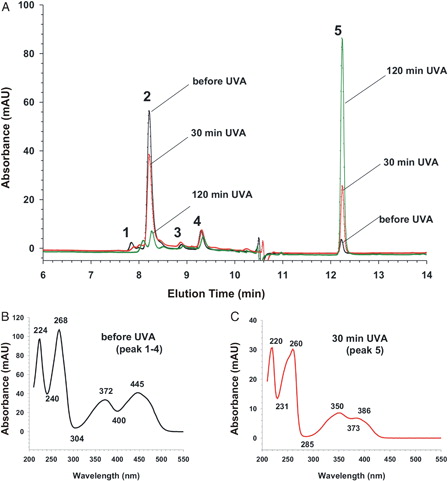
Figure 9. HPLC analysis of RF reaction mixture during UVA irradiation. (A) HPLC chromatograms (absorption at 254 nm) of 5 µl of aliquots of the RF-containing sample (25 µg RF/ml). Black chromatogram represents the reaction mixture before irradiation and red and green curves after 30- and 120-minute irradiation, respectively. Peaks were numbered from 1 to 5 according to elution time. The absorption peaks 1, 2, 3, and 4 (peak 1–4) have all the same UV-VIS spectrum, which is representatively shown in (B) from the peak 2. The UV-VIS spectrum of peak 5 is shown in (C) which is similar to UV-VIS spectrum of RF after UVA irradiation as in Fig. 8. The absorbance area of peak 2 diminishes whereas the absorbance area of peak 5 increases during UVA irradiation of the RF sample.