Figures & data
Table 1. Clinical parameters of dialysis patients
Figure 1. Level of plasma para-tyrosine (A) and ortho-tyrosine (B) in controls (CONTR), hemodialyzed patients without ESA-treatment (non-ESA-HD), hemodialyzed patients with ESA-treatment (ESA-HD), and patients with peritoneal dialysis (CAPD). para-Tyr, para-tyrosine; ortho-Tyr, ortho-tyrosine.
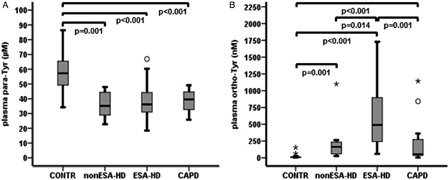
Figure 2. Correlations between [A] plasma ortho-tyrosine or [B] plasma ortho-tyrosine/para-tyrosine and ESA-dose/body weight. Correlations between [C] plasma ortho-tyrosine or [D] plasma ortho-tyrosine/para-tyrosine and ERI1 = ESA-dose/body weight/hemoglobin. ortho-Tyr, ortho-tyrosine; para-Tyr, para-tyrosine.
![Figure 2. Correlations between [A] plasma ortho-tyrosine or [B] plasma ortho-tyrosine/para-tyrosine and ESA-dose/body weight. Correlations between [C] plasma ortho-tyrosine or [D] plasma ortho-tyrosine/para-tyrosine and ERI1 = ESA-dose/body weight/hemoglobin. ortho-Tyr, ortho-tyrosine; para-Tyr, para-tyrosine.](/cms/asset/e7209608-6910-4fad-ae8e-6418b0143c03/yrer_a_11743416_f0002_b.jpg)
Table 2. Predictors of ESA-demand (plasma para-tyrosine/phenylalanine ratio included)
Table 3. Predictors of ESA-demand (plasma ortho-tyrosine/phenylalanine ratio included)
Table 4. Predictors of ESA-demand (plasma ortho-tyrosine/para-tyrosine ratio included)
Figure 3. Time kinetics of plasma ortho-tyrosine level when DA is not administered (ESA−) and when administered (ESA+). *, end of HD, at ESA+ the time of DA administration. Pairwise comparisons of ESA− and ESA+ at each time point were not significant. Data represent mean ± SD. ortho-Tyr, ortho-tyrosine.
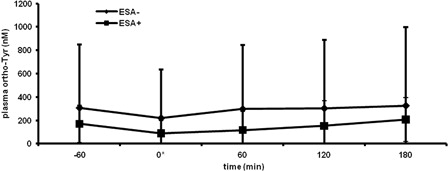
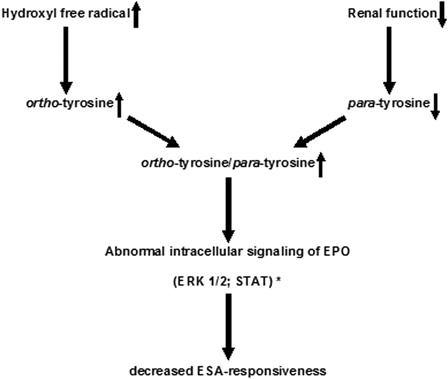
Figure 4. Possible mechanism of development of ESA-hyporesponsiveness in ESRF patients via inhibition of intracellular signaling pathways. * According to the findings of Ruggiero et al.22