Figures & data
Table 1. Age, gender, BMI, dietary and lifestyle habits of patients and controls
Table 2. Markers of lipid peroxidation, protein oxidation, activities of oxidant enzymes and antioxidant defence in controls and AC group in relation to disease stage and treatment response
Table 3. Markers of lipid peroxidation, protein oxidation, activities of oxidant enzymes and antioxidant defence in controls and AIH group in relation to disease stage and treatment response
Figure 1. Markers of oxidative stress in controls and AC patients according to Ludwig's stage. Levels of 3-NT (A), PC (B), isoprostane (C), aldehydes (D), oxidized/total GSH ratio (E), and reduced glutathione (F). The results are expressed as median, interquartile range, and range. P values refer to the comparison between each stage to controls (Mann–Whitney U test).
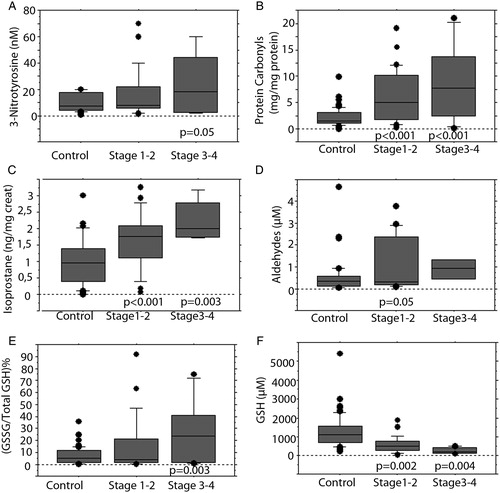
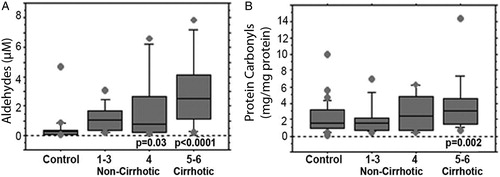
Figure 2. Products of oxidative stress injury products in controls and AIH patients according to the stage of fibrosis. Products of lipid (A) and protein (B) oxidation. The results are expressed as median, interquartile range, and range. P values refer to the comparison between each stage to controls (Mann–Whitney U test).