Figures & data
Table 1. Primer sequences used for RT-PCR analysis
Table 2. Activities of toxicity marker enzymes
Table 3. Activity of alcohol dehydrogenase and ROS levels in liver
Table 4. Activities of glutathione peroxidase (GPx), glutathione reductase (GR), and glutathione-S-transferase (GST)
Table 5. Level of lipid peroxidation products
Figure 1. ELISA of nuclear translocation of Nrf2
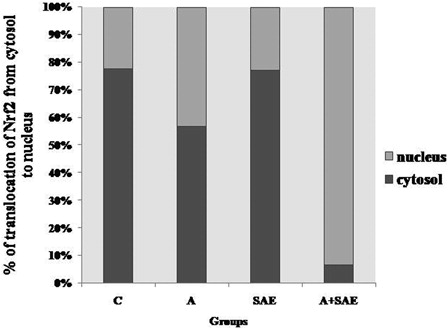
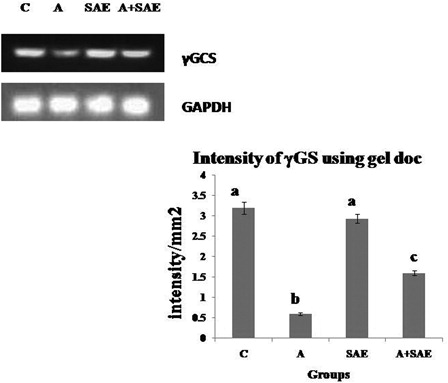
Figure 2. Intensity of γGCS mRNA using gel doc. The relative amount of γGCS mRNA was estimated by semi-quantitative RT-PCR. The PCR products were quantified by densitometry and standardized to their respective GAPDH controls. The mean intensity was measured and expressed as intensity/mm2. Results are expressed as average of quadriplicate experiments ± SD. Different letters indicate values statistically significant at P < 0.05. The level of γGCS mRNA was decreased significantly in alcohol-treated rats compared to control rats and there was an increase in the level in co-administered group compared to alcohol-treated group.