Figures & data
Figure 1. Capsaicin epoxide synthesis. Capsaicin (Sigma) (compound 1, 12 mg diluted in dichloromethane) was mixed with m-chloroperoxybenzoic acid (10 mg) at room temperature. Capsaicin epoxide (N-(4-hydroxy-3-methoxybenzyl)-5-[3-(propan-2-yl)oxiran-2-yl]pentanamide, compound 2, pale yellow oil, 11 mg, 87% yield) was isolated by column chromatography. m-CPBA, m-chloroperoxybenzoic acid; DCM, dichloromethane; rt, room temperature.
![Figure 1. Capsaicin epoxide synthesis. Capsaicin (Sigma) (compound 1, 12 mg diluted in dichloromethane) was mixed with m-chloroperoxybenzoic acid (10 mg) at room temperature. Capsaicin epoxide (N-(4-hydroxy-3-methoxybenzyl)-5-[3-(propan-2-yl)oxiran-2-yl]pentanamide, compound 2, pale yellow oil, 11 mg, 87% yield) was isolated by column chromatography. m-CPBA, m-chloroperoxybenzoic acid; DCM, dichloromethane; rt, room temperature.](/cms/asset/592d55a6-bec4-462c-a053-53ab9f5c092f/yrer_a_11674809_f0001_b.jpg)
Figure 2. Capsaicin epoxide characteristics. The quality (purity) and molecular mass of the synthesized capsaicin epoxide (N-(4-hydroxy-3-methoxybenzyl)-5-[3-(propan-2-yl)oxiran-2-yl]pentanamide, compound 2) were evaluated by NMR spectroscopy (A and B), gas chromatography (C), and ESI-TOF mass spectrometry (D). (A) The 400-MHz 1H NMR spectrum of compound 2. (B) The 100-MHz 13C NMR spectrum of compound 2. 1H NMR: (400 MHz) δ (ppm): 0.94 and 1.00 (2d, J = 6 Hz, 6H, –CH(CH3)2), 1.40–1.60 (m, 4H, –CH2–), 1.66–1.79 (m, 3H, –CH2– and –CH(CH3)2, 2.22 (t, J = 8 Hz, 2H, –CH2C=O), 2.44 (dd, J = 4 Hz, 1H, –CH–O–), 2.68–2.72 (m, 1H, –CH–O–), 3.88 (s, 3H, –OCH3), 3.36 (d, J = 4 Hz, 2H, –CH2–NH–), 5.63 (br s, 1H, –OH or –NH–), 5.72 (br s, 1H, –OH or –NH–), 6.75–6.87 (m, 3H, aromatic H).13C NMR: (100 MHz) δ (ppm): 18.4, 19.0 (2C, –CH(CH3)2), 25.4, 25.8, 30.5, 31.8 (4C, –CH2–), 36.6 (1C, –CH(CH3)2, 43.6 (1C, –CH2–NH–), 55.9, 57.6 (2C, epoxide C), 64.2 (1C, –OCH3), 110.7, 114.4, 120.8, 130.3, 145.1, 146.7 (6C, aromatic C), 172.5 (1C, =C=O). (C) The gas chromatographic analysis of compound 2: Rt = 7.038 minutes (98%). (D) ESI (HR MS) data spectrum of compound 2 (calculated for C18H27NO4Na (MNa+): 344.1838; found: 344.1835).
![Figure 2. Capsaicin epoxide characteristics. The quality (purity) and molecular mass of the synthesized capsaicin epoxide (N-(4-hydroxy-3-methoxybenzyl)-5-[3-(propan-2-yl)oxiran-2-yl]pentanamide, compound 2) were evaluated by NMR spectroscopy (A and B), gas chromatography (C), and ESI-TOF mass spectrometry (D). (A) The 400-MHz 1H NMR spectrum of compound 2. (B) The 100-MHz 13C NMR spectrum of compound 2. 1H NMR: (400 MHz) δ (ppm): 0.94 and 1.00 (2d, J = 6 Hz, 6H, –CH(CH3)2), 1.40–1.60 (m, 4H, –CH2–), 1.66–1.79 (m, 3H, –CH2– and –CH(CH3)2, 2.22 (t, J = 8 Hz, 2H, –CH2C=O), 2.44 (dd, J = 4 Hz, 1H, –CH–O–), 2.68–2.72 (m, 1H, –CH–O–), 3.88 (s, 3H, –OCH3), 3.36 (d, J = 4 Hz, 2H, –CH2–NH–), 5.63 (br s, 1H, –OH or –NH–), 5.72 (br s, 1H, –OH or –NH–), 6.75–6.87 (m, 3H, aromatic H).13C NMR: (100 MHz) δ (ppm): 18.4, 19.0 (2C, –CH(CH3)2), 25.4, 25.8, 30.5, 31.8 (4C, –CH2–), 36.6 (1C, –CH(CH3)2, 43.6 (1C, –CH2–NH–), 55.9, 57.6 (2C, epoxide C), 64.2 (1C, –OCH3), 110.7, 114.4, 120.8, 130.3, 145.1, 146.7 (6C, aromatic C), 172.5 (1C, =C=O). (C) The gas chromatographic analysis of compound 2: Rt = 7.038 minutes (98%). (D) ESI (HR MS) data spectrum of compound 2 (calculated for C18H27NO4Na (MNa+): 344.1838; found: 344.1835).](/cms/asset/ef8fc2ac-fbb2-4ee3-9ca5-e67bdfa8c700/yrer_a_11674809_f0002_b.jpg)
Figure 3. Capsaicin- and capsaicin epoxide-induced decrease in metabolic activity. The capsaicin and capsaicin epoxide cytotoxicities were estimated by measuring the ability of live cells to metabolize 3-(4,5-dimethylthiazol-2-yl)-2,5-diphenyltetrazolium bromide (MTT) to formazan. HDFs, human dermal fibroblasts; NIH3T3, mouse embryonic fibroblasts; DU145, human prostate carcinoma cells; A549, human lung carcinoma cells; MCF7, human breast carcinoma cells; HeLa, human cervical carcinoma cells; ACHN, human renal carcinoma cells. The bars indicate the SD (n = 5). *P < 0.05 and ***P < 0.001 compared with the control conditions (24-hour treatment with capsaicin versus the control conditions); ###P < 0.001 compared with the control conditions (24-hour treatment with capsaicin epoxide versus the control conditions); +P < 0.05 and +++P < 0.001 compared with 24-hour treatment with capsaicin (24-hour treatment with capsaicin versus 24-hour treatment with capsaicin epoxide) (ANOVA and Tukey's a posteriori test).
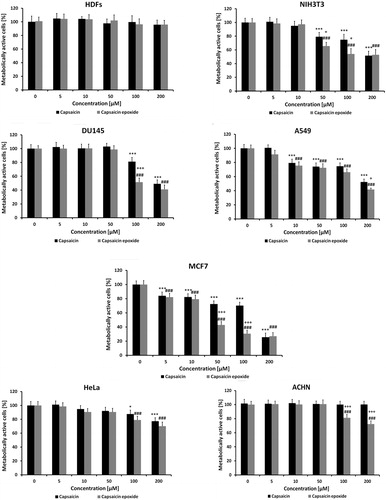
Figure 4. Capsaicin- and capsaicin epoxide-mediated apoptosis of MCF7 cells. After 24-hour treatment with capsaicin (CAP) or capsaicin epoxide (CAPO) (50 µM), apoptosis was assessed using the Muse™ Cell Analyser and the Muse™ Multi-caspase Kit. Treatments with hydrogen peroxide and tert-butyl hydroperoxide (tBOOH) (10 mM, 0.5 and 3 hours) were used as positive controls. Representative multi-caspase profiles (dot plots) are presented.
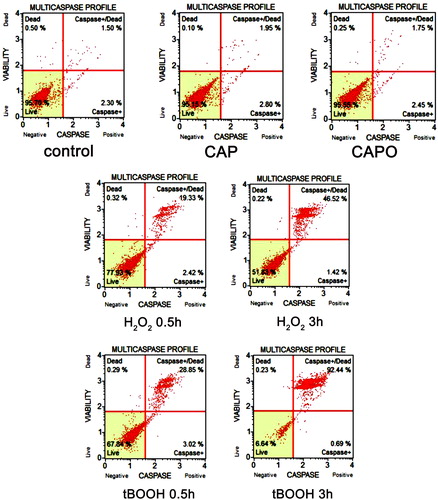
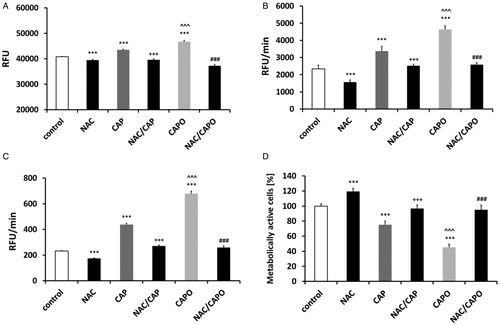
Figure 5. Capsaicin- and capsaicin epoxide-mediated oxidative stress and the effect of N-acetyl cysteine (NAC) in MCF7 cells. The steady-state level of reactive oxygen species (ROS) in the cell culture medium (A) and the intracellular ROS production (B) were measured with 2′,7′-dichlorodihydrofluorescein diacetate (H2DCF-DA), and superoxide production (C) was measured with dihydroethidium. (D) The NAC-mediated recovery of the proliferative potential was estimated using the MTT assay. The bars indicate the SD (n = 5). ***P < 0.001 compared with the control conditions; ^ ^ ^P < 0.001 compared with 24-hour treatment with capsaicin (CAP) (24-hour treatment with 50 µM capsaicin versus 24-hour treatment with 50 µM capsaicin epoxide); +++P < 0.001 compared with 24-hour treatment with capsaicin (24-hour treatment with 50 µM capsaicin versus 2-hour pretreatment with 5 mM NAC and 24-hour treatment with 50 µM capsaicin, NAC/CAP); ###P < 0.001 compared with 24-hour treatment with capsaicin epoxide (CAPO) (24-hour treatment with 50 µM capsaicin epoxide versus 2-hour pretreatment with 5 mM NAC and 24-hour treatment with 50 µM capsaicin epoxide, NAC/CAPO) (ANOVA and Tukey's a posteriori test).