Figures & data
Figure 1 Microscopic images of the jejunum showing the histopathological samples of laparotomy (A), IR (B), and IR + PG (C) groups (H&E, 200×). (A) Mucosa with normal villous formation. (B) Disintegration of the villous (star), capillary dilatation, ulceration of lamina propria (arrow), capillary dilatation, infiltration, and hemorrhage (arrowhead) after IR injury. (C) Restitution of jejunal mucosa in the pomegranate-applied group.
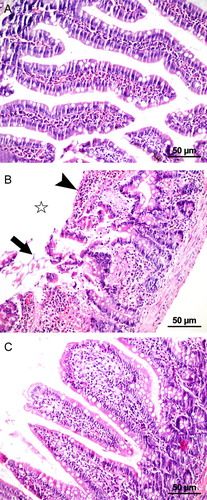
Figure 2 Microscopic images of the liver showing the histopathological samples of laparotomy (A), IR (B), and IR + PG (C) groups (H&E, 200×). (A) Normal hepatocyte formation. (B) Degenerative changes (area marked with arrowheads); necrosis and picnotic nucleus (arrows). (C) Hepatocytes in pomegranate applied group with few picnotic changes (arrows).
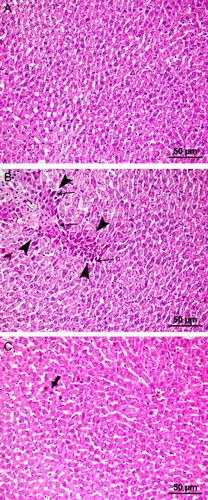
Table 1 Oxidative and antioxidative parameters of all groups
Figure 3 Comparison of OSI levels in the groups. Lap, laparotomy; PG, pomegranate; IR, ischemia–reperfusion.
Figure 4 Comparison of the lung, kidney, intestinal, and liver histopathologic score levels in the groups. Lap, laparotomy; PG, pomegranate; IR, ischemia–reperfusion.