Figures & data
Figure 1 (A) Effect of NaAsO2 on isolated mouse hepatocytes. (B) Time- and dose-dependent effect on cell viability in absence (NaAsO2) and presence of AEEF in isolated murine hepatocytes. Values are expressed as mean ± SE (n = 3). (C) Hoechst staining of murine hepatocytes in absence (NaAsO2) and presence of AEEF.
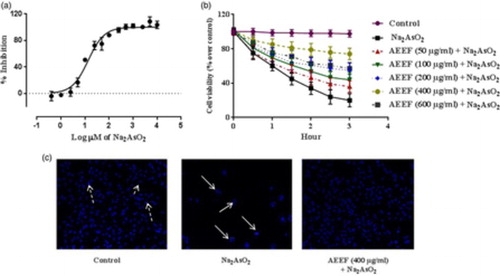
Table 1 ROS production, lipid peroxidation, protein carbonylation, and antioxidant parameters in the absence (NaAsO2) and presence of AEEF (AEEF + NaAsO2) in isolated mouse hepatocytes
Figure 2 Respective Western blot analysis of the intrinsic transcription proteins (A) viz. Bad, Bcl-2, cleaved caspase-9, cleaved caspase-3, and the extrinsic transcription proteins (B) viz. Fas, Bid, and cleaved caspase-8 in absence (NaAsO2) and presence of AEEF followed by densitometric analysis of the respective protein levels and the normal control band was given an arbitrary value of 1. beta-Actin was used as a loading protein. Values are expressed as mean ± SE (n=3). $Values differ significantly (P < 0.05) from normal control. #Values differ significantly (P < 0.01) from normal control.
*Values differ significantly (P < 0.05) from toxic control. **Values differ significantly (P < 0.01) from toxic control.
Table 2 Hematological and serum biochemical parameters in the absence (NaAsO2) and presence of AEEF (AEEF + NaAsO2) in mice
Table 3 ROS production, lipid peroxidation, protein carbonylation, and antioxidant markers in the absence (NaAsO2) and presence of AEEF (AEEF + NaAsO2) in mouse liver
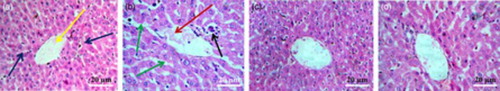
Figure 3 Histological sections of livers of normal mice (A), NaAsO2-treated mice (B), mice pretreated with AEEF (50 mg/kg) followed by NaAsO2 (C), and mice pretreated with AEEF (100 mg/kg) followed by NaAsO2 (D). Blue arrows represent normal hepatocytes and yellow arrow represents central vein; red arrow represents dilated portal vein; green arrows represent enlarged sinusoids between the plates of hepatocytes; and black arrow represents infiltrating leukocytes.