Figures & data
Figure 1 Scatter plot demonstrating the relationship between pleural fluid DJ-1 levels and SOD1 levels.
Figure 2 Scatter plot demonstrating the relationship between pleural fluid DJ-1 levels and 8-isoprostane levels.
Figure 3 Scatter plot demonstrating the relationship between pleural fluid DJ-1 and LDH levels.
Figure 4 Scatter plot demonstrating the relationship between pleural fluid DJ-1 levels and total cell count.
Table 1 DJ-1's correlations and associations
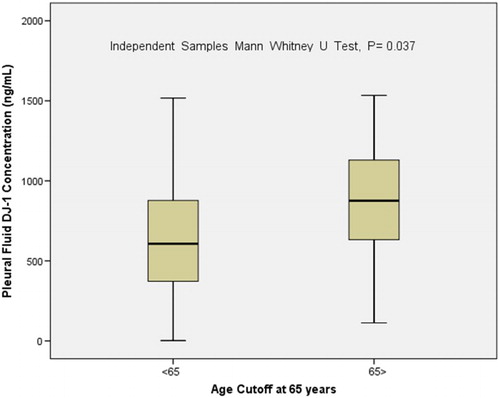
Figure 5 Box plot demonstrating the differences between pleural fluid DJ-1's levels in patients aged above vs. below 65 years of age.