Publication Cover
Redox Report
Communications in Free Radical Research
Volume 21, 2016 - Issue 4
1,260
Views
3
CrossRef citations to date
0
Altmetric
Original Articles

The thioredoxin system and not the Michaelis–Menten equation should be fitted to substrate saturation datasets from the thioredoxin insulin assay

&

Figures & data

Table 1 Kinetic parameters and species concentrations used for building computational models of the E. coli and baker's yeast thioredoxin systems

Figure 1 The Michaelis–Menten equation and the thioredoxin redox couple model both fit an in vitro insulin reduction datasetCitation13 but the resulting kinetic models show distinct responses to thioredoxin reductase concentration and substrate saturation. In (A) the Michaelis–Menten equation and the thioredoxin redox couple kinetic model (black line) both showed excellent fits (r2 ≥ 0.996) to an insulin substrate saturation dataset (•). Increasing the thioredoxin reductase concentration (0.05 µM) in the thioredoxin redox couple model to 0.15 (blue) or 0.25 µM (green) increased the flux within the system at a given insulin concentration. Substrate saturation (black) within a fitted thioredoxin redox couple model (0.05 µM TR) was accompanied by the redistribution of thioredoxin from its reduced (blue) to oxidized (red) form (B). In (C) disulfide bond rather than insulin concentration was used to determine the kinetic parameters for thioredoxin-dependent insulin reduction.

Figure 1 The Michaelis–Menten equation and the thioredoxin redox couple model both fit an in vitro insulin reduction datasetCitation13 but the resulting kinetic models show distinct responses to thioredoxin reductase concentration and substrate saturation. In (A) the Michaelis–Menten equation and the thioredoxin redox couple kinetic model (black line) both showed excellent fits (r2 ≥ 0.996) to an insulin substrate saturation dataset (•). Increasing the thioredoxin reductase concentration (0.05 µM) in the thioredoxin redox couple model to 0.15 (blue) or 0.25 µM (green) increased the flux within the system at a given insulin concentration. Substrate saturation (black) within a fitted thioredoxin redox couple model (0.05 µM TR) was accompanied by the redistribution of thioredoxin from its reduced (blue) to oxidized (red) form (B). In (C) disulfide bond rather than insulin concentration was used to determine the kinetic parameters for thioredoxin-dependent insulin reduction.

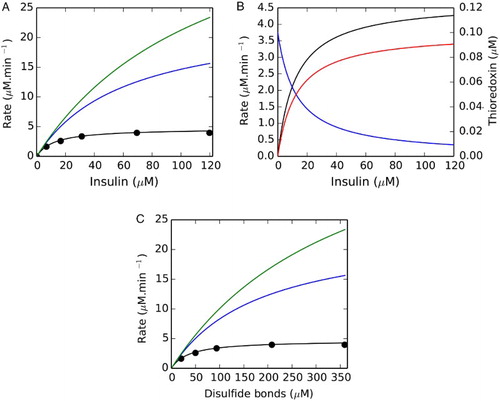
Table 2 The Michaelis–Menten parameters and second-order rate constants (k2) for insulin reduction from computational modeling of the E. coli thioredoxin system at varying thioredoxin reductase concentrations

Figure 2 Ni-NTA affinity purification of recombinant thioredoxin (A) and thioredoxin reductase (B) (details in text).

Figure 2 Ni-NTA affinity purification of recombinant thioredoxin (A) and thioredoxin reductase (B) (details in text).

Figure 3 Similar rates were obtained when the thioredoxin insulin assay was initiated with thioredoxin reductase or NAPDH. Insulin reduction by the thioredoxin system was initiated with either thioredoxin reductase (A) or NADPH (B) and a decrease in absorbance was monitored over negative and positive scales, respectively. The assay contained insulin (80 µM), thioredoxin reductase (0.05 µM), thioredoxin (1.5 µM), and NADPH (150 µM) and was performed in duplicate.

Figure 3 Similar rates were obtained when the thioredoxin insulin assay was initiated with thioredoxin reductase or NAPDH. Insulin reduction by the thioredoxin system was initiated with either thioredoxin reductase (A) or NADPH (B) and a decrease in absorbance was monitored over negative and positive scales, respectively. The assay contained insulin (80 µM), thioredoxin reductase (0.05 µM), thioredoxin (1.5 µM), and NADPH (150 µM) and was performed in duplicate.

Figure 4 Changing the thioredoxin reductase concentration altered the kinetic profile and parameters obtained with the yeast thioredoxin insulin reduction assay. The flux obtained for a given insulin concentration increased as the thioredoxin reductase concentration was increased over the range 0.05 (•), 0.15 (▪), and 0.25 µM (♦). The Michaelis–Menten equation and the redox couple model were both fitted to these datasets using either insulin concentration (A) or the disulfide bond concentration (B). All assays were performed in triplicate with standard errors shown.

Figure 4 Changing the thioredoxin reductase concentration altered the kinetic profile and parameters obtained with the yeast thioredoxin insulin reduction assay. The flux obtained for a given insulin concentration increased as the thioredoxin reductase concentration was increased over the range 0.05 (•), 0.15 (▪), and 0.25 µM (♦). The Michaelis–Menten equation and the redox couple model were both fitted to these datasets using either insulin concentration (A) or the disulfide bond concentration (B). All assays were performed in triplicate with standard errors shown.

Table 3 The Michaelis–Menten parameters and second-order rate constants (k2) for insulin reduction by the baker's yeast thioredoxin system at varying thioredoxin reductase concentrations

Figure 5 Substrate saturation is associated with redistribution of the thioredoxin moiety into its oxidized form in the insulin reduction assay. Reduced thioredoxin in the insulin reduction assay was alkylated with PEG-maleimide. As migration controls, reduced thioredoxin was obtained by incubating thioredoxin (1.5 µM) with DTT (1 mM), while purified thioredoxin served as the oxidized control. The experiment was performed in triplicate over a range of thioredoxin reductase concentrations (0.05–0.25 µM) and a representative gel image is shown here.

Figure 5 Substrate saturation is associated with redistribution of the thioredoxin moiety into its oxidized form in the insulin reduction assay. Reduced thioredoxin in the insulin reduction assay was alkylated with PEG-maleimide. As migration controls, reduced thioredoxin was obtained by incubating thioredoxin (1.5 µM) with DTT (1 mM), while purified thioredoxin served as the oxidized control. The experiment was performed in triplicate over a range of thioredoxin reductase concentrations (0.05–0.25 µM) and a representative gel image is shown here.
Supplemental material

supplementary_information.docx

Download MS Word (21.5 KB)

Reprints and Corporate Permissions

Please note: Selecting permissions does not provide access to the full text of the article, please see our help page How do I view content?

To request a reprint or corporate permissions for this article, please click on the relevant link below:

Academic Permissions

Please note: Selecting permissions does not provide access to the full text of the article, please see our help page How do I view content?

Obtain permissions instantly via Rightslink by clicking on the button below:

If you are unable to obtain permissions via Rightslink, please complete and submit this Permissions form. For more information, please visit our Permissions help page.