Figures & data
Table 1 Levels of plasma antioxidants and lipids in patients with ALS as compared to age-matched healthy controls (average ± SD)
Figure 1 Time course of changes of ALSFRS-R at 6 months with and without edaravone treatment (mean ± SE). Repeated-measures ANOVA shows a significant difference in ΔALSFRS-R between the two groups (P < 0.008). Inset table provides the raw ALSFRS-R values.
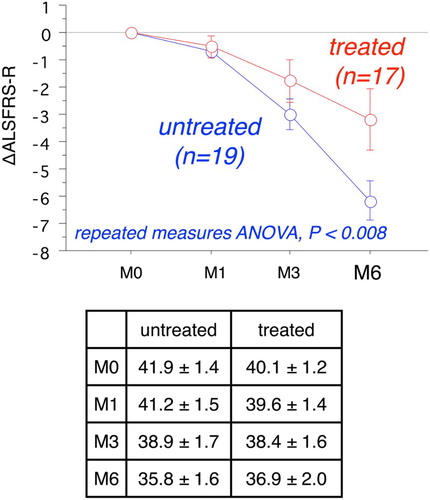
Table 2 Classification of patients according to the value of ΔALSFRS-R (Δ) at 6 months in edaravone-treated and -untreated groups of ALS patients
Figure 2 The increase or decrease of plasma urate levels, calculated from values at week 0 (before edaravone administration), during the course of edaravone treatment in ALS patients. Patients were divided into a satisfactory progress group, an ingravescent group, and a middle group according to their values of ΔALSFRS-R determined at 6 months of treatment. W0B/A and W1B/A are data for week 0 and week 1 before (B) and after (A) edaravone treatment, respectively; M1–6B/A are data for months 1–6 before (B) and after (A) edaravone treatment. Data for patients for whom the month 6 observation was missing are indicated by solid symbols.
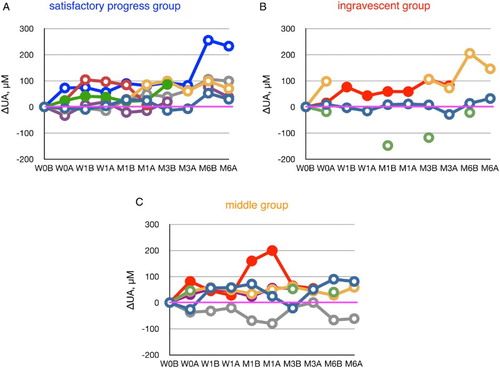
Figure 3 Time course of changes in plasma ascorbate (VC) during edaravone treatment in ALS patients. Patients were divided into three groups according to the value of ΔALSFRS-R at 6 months of treatment. The average VC level in age-matched healthy controls was 31.1 ± 21.0 µM (±SD, n = 55); this range is shaded in green. W0B/A and W1B/A are data for week 0 and week 1 before (B) and after (A) edaravone treatment, respectively; M1–6B/A are data for months 1–6 before (B) and after (A) edaravone treatment. Data for patients for whom the month 6 observation was missing are indicated by solid symbols.
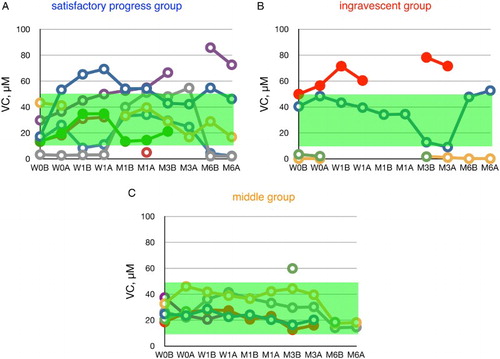
Figure 4 Time course of changes in the ratio of ubiquinone-10 to TQ10 (%CoQ10) during edaravone treatment in ALS patients. Patients were divided into three groups according to their values of ΔALSFRS-R determined at 6 months of treatment. Average %CoQ10 in age-matched healthy controls was 3.9 ± 1.3 (±SD, n = 55); this range is shaded in green. W0B/A and W1B/A are data for week 0 and week 1 before (B) and after (A) edaravone treatment, respectively; M1–6B/A are data for months 1–6 before (B) and after (A) edaravone treatment. Data for patients for whom the month 6 observation was missing are indicated by solid symbols.
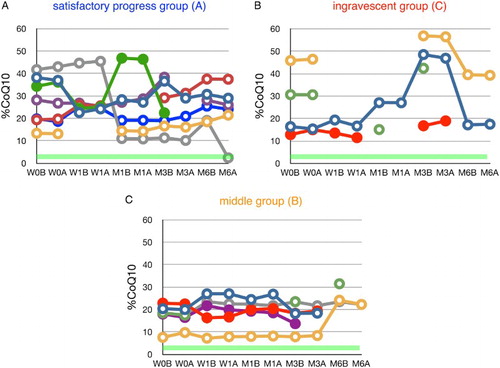
Figure 5 Time course of changes in plasma FFA during edaravone treatment in ALS patients. Patients were divided into three groups according to their values of ΔALSFRS-R determined at 6 months of treatment. FFA level in age-matched healthy controls was 457 ± 288 µM (average ± SD, n = 55); the region above this range is shaded in red. W0B/A and W1B/A are data for week 0 and week 1 before (B) and after (A) edaravone treatment, respectively; M1–6B/A are data for months 1–6 before (B) and after (A) edaravone treatment. Data for patients for whom the month 6 observation was missing are indicated by solid symbols. Inset table shows the incidence of FFA levels greater than 745 µM (=average + SD) and the P value (Fisher's exact probability test) versus data for the ingravescent group.
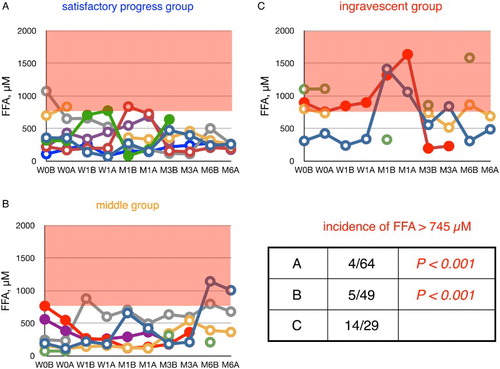
Figure 6 Time course of changes in plasma ratio of PUFA to total FFA (%PUFA) in ALS patients. Patients were divided into three groups according to their values of ΔALSFRS-R determined at 6 months of treatment. %PUFA in age-matched healthy controls was 23.6 ± 4.6% (average ± SD, n = 55); the region below this range is shaded in red. W0B/A and W1B/A are data for week 0 and week 1 before (B) and after (A) edaravone treatment, respectively; M1–6B/A are data for months 1–6 before (B) and after (A) edaravone treatment. Data for patients for whom the month 6 observation was missing are indicated by solid symbols. Inset table shows the incidence of %PUFA smaller than 19.0% (= average − SD) and the P value (Fisher's exact probability test) versus data for the ingravescent group.
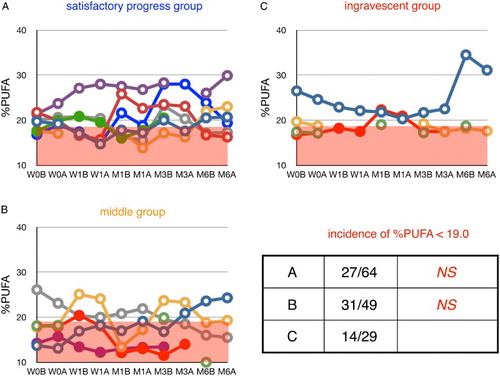
Figure 7 Time course of changes in plasma ratio of palmitoleic acid to total FFA (%16:1) during edaravone treatment in ALS patients. Patients were divided into three groups according to their values of ΔALSFRS-R determined at 6 months of treatment. %16:1 in age-matched healthy control was 3.9 ± 1.4% (average ± SD, n = 55); the region above this range is shaded in red. W0B/A and W1B/A are data for week 0 and week 1 before (B) and after (A) edaravone treatment, respectively; M1–6B/A are data for months 1–6 before (B) and after (A) edaravone treatment. Data for patients for whom the month 6 observation was missing are indicated by solid symbols. Inset table shows the incidence of %16:1 greater than 5.3% (=average + SD) and the P value (Fisher's exact probability test) versus data for the ingravescent group.
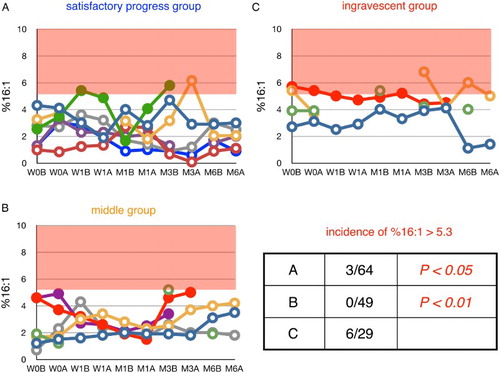
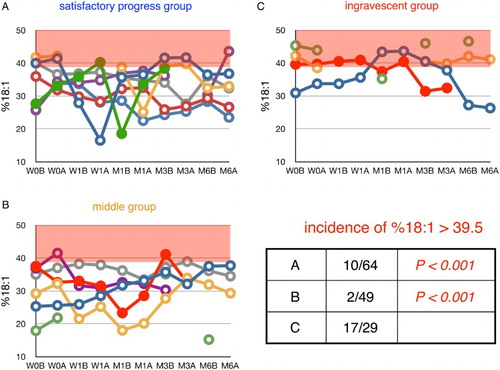
Figure 8 Time course of changes in plasma ratio of oleic acid to total FFA (%18:1) during edaravone treatment in ALS patients. Patients were divided into three groups according to their values of ΔALSFRS-R determined at 6 months of treatment. %18:1 in age-matched healthy controls was 34.4 ± 5.1% (average ± SD, n = 55); the region above this range is shaded in red. W0B/A and W1B/A are data for week 0 and week 1 before (B) and after (A) edaravone treatment, respectively; M1–6B/A are data for months 1–6 before (B) and after (A) edaravone treatment. Data for patients for whom the month 6 observation was missing are indicated by solid symbols. Inset table shows the incidence of %16:1 greater than 39.5% (=average + SD) and the P value (Fisher's exact probability test) versus data for the ingravescent group.