Publication Cover
Redox Report
Communications in Free Radical Research
Volume 21, 2016 - Issue 4
662
Views
7
CrossRef citations to date
0
Altmetric
Research Article

Time courses of changes of para-, meta-, and ortho-tyrosine in septic patients: A pilot study

, , , , , , , , , & show all

Figures & data

Table 1 Demographic and clinical data of patients

Figure 1 Chromatograms of a standard (STD: 9.375 µmol/l p-Tyr; 187.5 nmol/l m-Tyr; 187.5 nmol/l o-Tyr; 14.062 µmol/l Phe), of sera of a control subject (CONTR), and a septic patient (SE) and chromatogram of a urine sample of a septic patient (SE-U). On the SE-U curve, p-Tyr and Phe show much smaller peaks (at 8.5 and 20.5 minutes, respectively), as they are present in urine in relatively small amounts because of the high rate of their reabsorption. Abbreviations: p-Tyr, para-tyrosine; m-Tyr, meta-tyrosine; o-Tyr, ortho-tyrosine; Phe, phenylalanine.
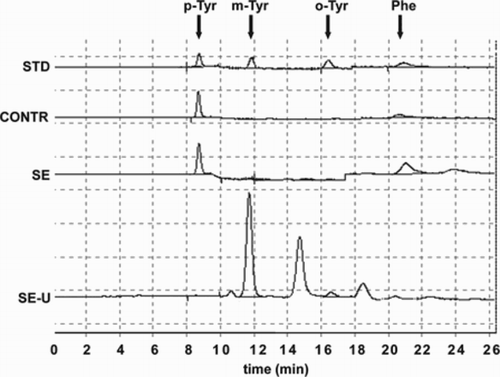
Figure 1 Chromatograms of a standard (STD: 9.375 µmol/l p-Tyr; 187.5 nmol/l m-Tyr; 187.5 nmol/l o-Tyr; 14.062 µmol/l Phe), of sera of a control subject (CONTR), and a septic patient (SE) and chromatogram of a urine sample of a septic patient (SE-U). On the SE-U curve, p-Tyr and Phe show much smaller peaks (at 8.5 and 20.5 minutes, respectively), as they are present in urine in relatively small amounts because of the high rate of their reabsorption. Abbreviations: p-Tyr, para-tyrosine; m-Tyr, meta-tyrosine; o-Tyr, ortho-tyrosine; Phe, phenylalanine.

Figure 2 Serum levels of (A) m-Tyr, (B) o-Tyr, and (C) p-Tyr in septic patients. Data are expressed as median and IQR (standard twenty-fifth to seventy-fifth percentile and fifth and ninety-fifth confidence interval). Asterisks indicate statistical differences within the septic group compared to day 1 (*: P < 0.05; **: P < 0.01). The ‘#’ symbols show significant differences between patients and controls. (#: P < 0.05; ##: P < 0.01). Serum p-Tyr levels showed a significant day-by-day elevation with trend analysis (P = 0.002).
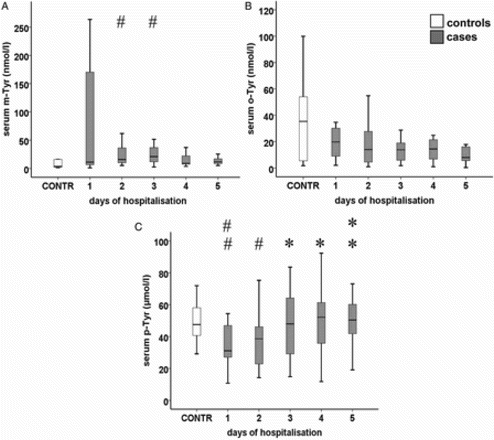
Figure 2 Serum levels of (A) m-Tyr, (B) o-Tyr, and (C) p-Tyr in septic patients. Data are expressed as median and IQR (standard twenty-fifth to seventy-fifth percentile and fifth and ninety-fifth confidence interval). Asterisks indicate statistical differences within the septic group compared to day 1 (*: P < 0.05; **: P < 0.01). The ‘#’ symbols show significant differences between patients and controls. (#: P < 0.05; ##: P < 0.01). Serum p-Tyr levels showed a significant day-by-day elevation with trend analysis (P = 0.002).

Figure 3 Urinary (A) m-Tyr/creatinine, (B) o-Tyr/creatinine, and (C) p-Tyr/creatinine ratio in septic patients. Data are expressed as median and IQR ((standard twenty-fifth to seventy-fifth percentile and fifth and ninety-fifth confidence interval). Asterisks indicate statistical differences within the septic group compared to day 1 (*: P < 0.05; **: P < 0.01; ***: P < 0.001). The ‘#’ symbols show significant differences between patients and controls. (#: P < 0.05; ##: P < 0.01; ###: P < 0.001). Urinary m-Tyr/creatinine ratios had a decreasing tendency (P = 0.018), while urinary p-Tyr/creatinine ratios showed a marked increase (P = 0.001).
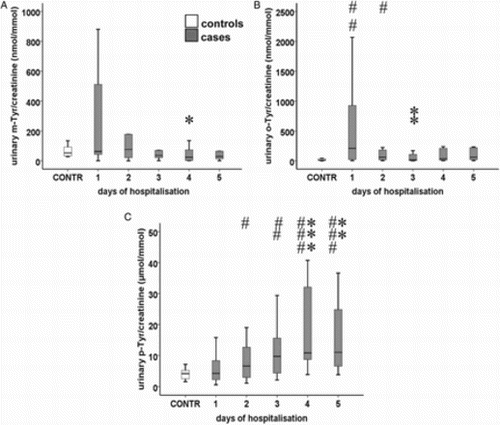
Figure 3 Urinary (A) m-Tyr/creatinine, (B) o-Tyr/creatinine, and (C) p-Tyr/creatinine ratio in septic patients. Data are expressed as median and IQR ((standard twenty-fifth to seventy-fifth percentile and fifth and ninety-fifth confidence interval). Asterisks indicate statistical differences within the septic group compared to day 1 (*: P < 0.05; **: P < 0.01; ***: P < 0.001). The ‘#’ symbols show significant differences between patients and controls. (#: P < 0.05; ##: P < 0.01; ###: P < 0.001). Urinary m-Tyr/creatinine ratios had a decreasing tendency (P = 0.018), while urinary p-Tyr/creatinine ratios showed a marked increase (P = 0.001).

Figure 4 (A) FE of p-, m-, and o-Tyr (IQR; standard twenty-fifth to seventy-fifth percentile and fifth and ninety-fifth confidence interval). FE of m-Tyr showed a decreasing tendency (P = 0.009). (B) FE of p-Tyr (IQR; standard twenty-fifth to seventy-fifth percentile and fifth and ninety-fifth confidence interval). Asterisk indicates a statistically relevant difference within the septic group compared to day 1 (*: P < 0.05). The ‘#’ symbols show significant differences between cases and controls (#: P < 0.05; ##: P < 0.01; ###: P < 0.001). The ‘+’ symbols show significant differences between FE of m- or o-Tyr and that of p-Tyr (+: P < 0.05; ++: P < 0.01; +++: P < 0.001).
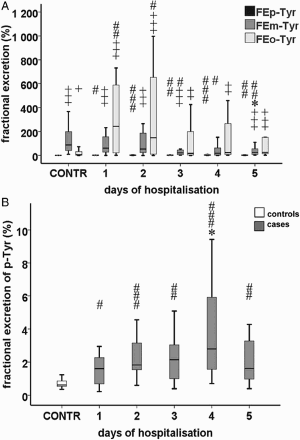
Figure 4 (A) FE of p-, m-, and o-Tyr (IQR; standard twenty-fifth to seventy-fifth percentile and fifth and ninety-fifth confidence interval). FE of m-Tyr showed a decreasing tendency (P = 0.009). (B) FE of p-Tyr (IQR; standard twenty-fifth to seventy-fifth percentile and fifth and ninety-fifth confidence interval). Asterisk indicates a statistically relevant difference within the septic group compared to day 1 (*: P < 0.05). The ‘#’ symbols show significant differences between cases and controls (#: P < 0.05; ##: P < 0.01; ###: P < 0.001). The ‘+’ symbols show significant differences between FE of m- or o-Tyr and that of p-Tyr (+: P < 0.05; ++: P < 0.01; +++: P < 0.001).

Table 2 Clinical data of patients on day 1

Figure 5 Serum levels of (A) PCT and (B) creatinine in septic patients. Data are expressed as median and IQR (standard twenty-fifth to seventy-fifth percentile and fifth and ninety-fifth confidence interval). A significant decreasing tendency was found in both parameters (P = 0.027; P = 0.033, respectively).
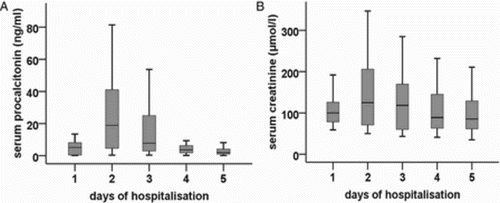
Figure 5 Serum levels of (A) PCT and (B) creatinine in septic patients. Data are expressed as median and IQR (standard twenty-fifth to seventy-fifth percentile and fifth and ninety-fifth confidence interval). A significant decreasing tendency was found in both parameters (P = 0.027; P = 0.033, respectively).

Reprints and Corporate Permissions

Please note: Selecting permissions does not provide access to the full text of the article, please see our help page How do I view content?

To request a reprint or corporate permissions for this article, please click on the relevant link below:

Academic Permissions

Please note: Selecting permissions does not provide access to the full text of the article, please see our help page How do I view content?

Obtain permissions instantly via Rightslink by clicking on the button below:

If you are unable to obtain permissions via Rightslink, please complete and submit this Permissions form. For more information, please visit our Permissions help page.