Figures & data
Table 1 Anthropometric and biochemical changes after 8 weeks of treatment depending on the diet
Table 2 Characteristics of the population classified by the response to the energy-restricted dietary program
Figure 1 Baseline DNA methylation levels of low and high responders to the intervention. (A) Baseline DNA methylation levels (%) of low responders and high responders adjusted for age, gender, and number of plate. P from ANCOVA test: *0.05 < P < 0.01; ***P < 0.001. (B) Pearson's correlation between total fat mass loss (kg) and baseline DNA methylation levels (%) of LINE-1; (C) Pearson's correlation between body weight loss (as kg) and baseline DNA methylation levels (%) of LINE-1. r 2 represents Pearson correlation coefficient and P is the stringency of the correlation. A P < 0.05 was considered statistically significant. Full circles: LR; empty circles: HR.
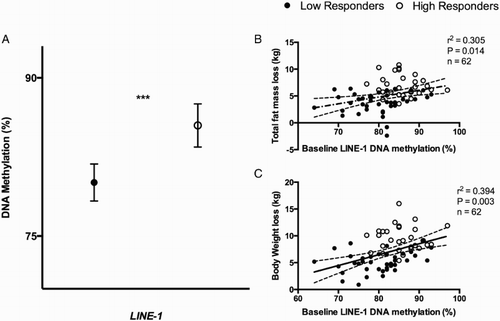
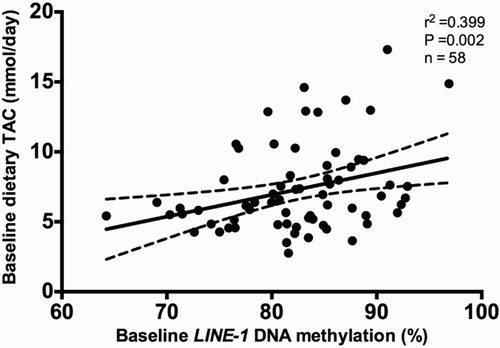
Figure 2 Pearson's correlation between baseline methylation levels (%) of LINE-1 and baseline dietary total antioxidant capacity (TAC; mmol/day), adjusted for age, sex, diet type, energy intake, and number of plate. r 2 represents Pearson correlation coefficient.