Figures & data
Table 1 Demographic features of participants
Table 2 Serum vitamin B12, homocysteine, and MMA, urine MMA, and hemoglobin, LDH, and HDL cholesterol values of participants
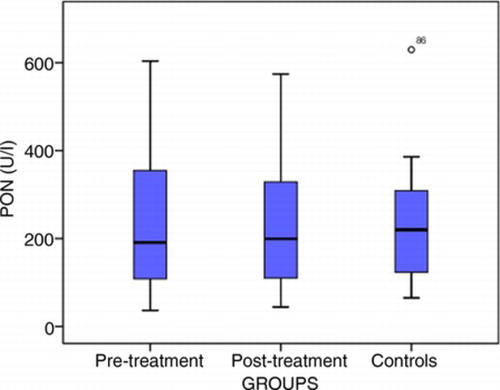
Figure 1 Distribution of PON levels. Horizontal lines indicate median values; purple bars indicate the interquartile range; and vertical lines indicate the minimum and maximum. PON, paraoxonase.
Figure 2 Distribution of ARES levels. Circles indicate the median levels. ARES, arylesterase.