Figures & data
Figure 1. Schematic diagram of various subzones in HAZ of P(T)91 weld and its approximate relation to calculated equilibrium phase diagramCitation7 (courtesy of P. Mayr)
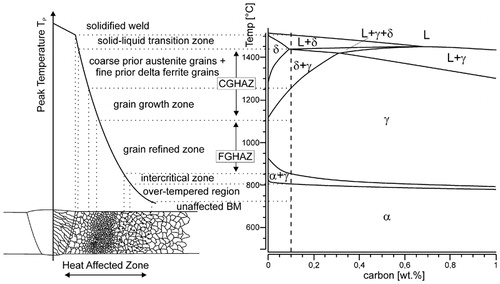
Table 1. Composition in of candidate CSEF steels/wt-%
Table 2. Potential CSEF steel boiler materials and applications for SC, USC and AUSC power plantsCitation8,Citation9
Table 3. Software tools for integrated modellingCitation24
Figure 2. Photograph of typical headerCitation25 (with permission of Springer Science)
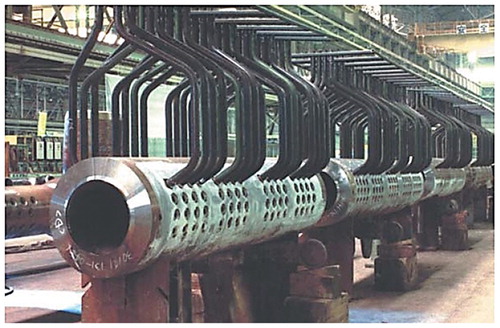
Figure 3. Phase diagram for water systemCitation26
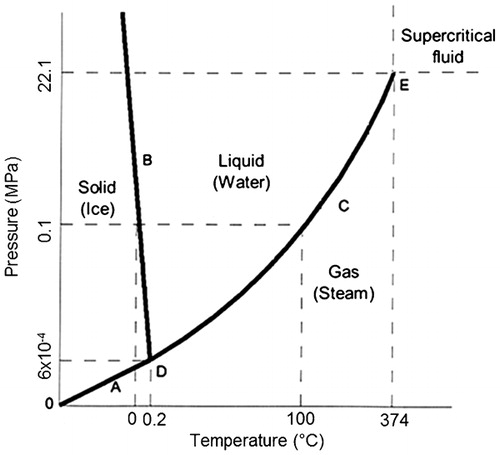
Table 4. Classification of coal fired power plantsCitation9
Figure 4. Average temperature for rupture in 105 h for various boiler materialsCitation32
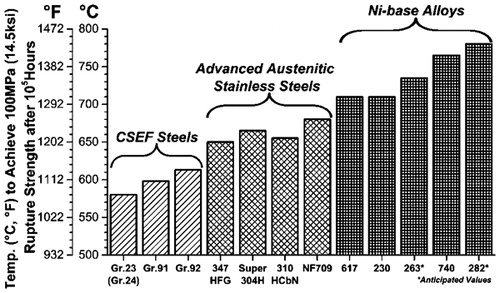
Figure 5. Allowable stress for various alloys comparing temperature capabilitiesCitation32,Citation34
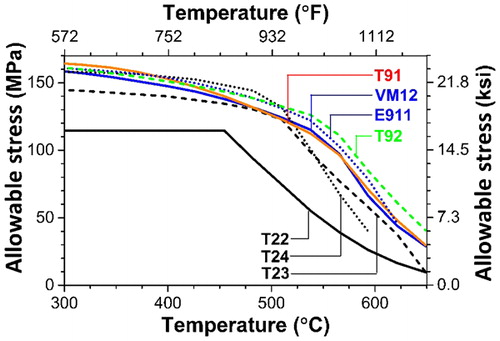
Figure 6. Evolution of ferritic steelsCitation1,Citation32
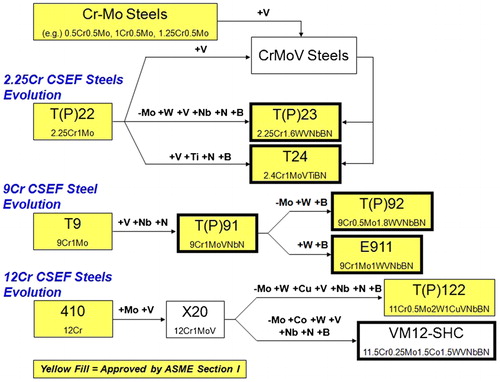
Figure 7. Relative wall thickness for piping and tubing made of P(T)91, P22 and other ferritic steels for same design conditionsCitation36
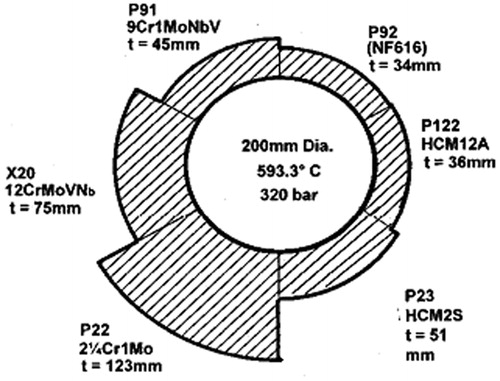
Figure 8. Images (a SEM and b TEM) of normalised and tempered P(T)91 steelCitation40 (with permission of Springer Science)
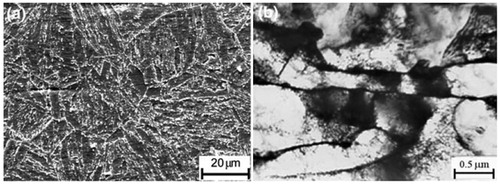
Table 5. Transformation temperatures in °C, Normalization and PWHT ranges for CSEF steelsCitation32
Figure 9. Graph representation of possible ranges of A1 temperature for CSEF steelsCitation38
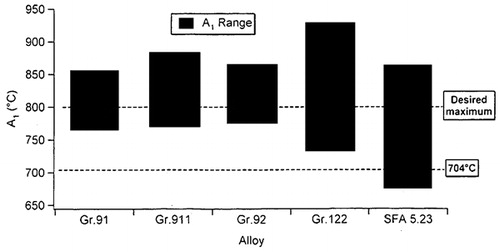
Figure 10. Combination of materials and welding processes involved in fabrication of stream boiler componentCitation45
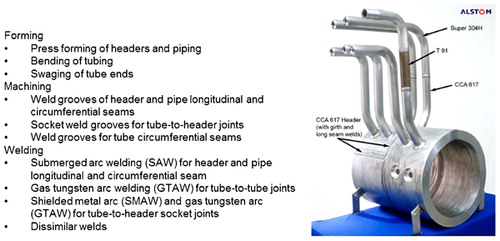
Table 6. Examples of welding consumablesCitation20,Citation44
Figure 11. Typical weld thermal cycle for P(T)91 steel component during PWHTCitation20
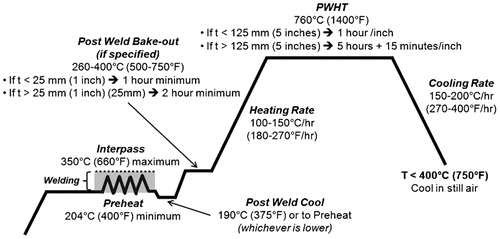
Table 7. Recommended preheat and interpass temperatures for common CSEF steelsCitation32
Figure 12. Macrostructure of multipass weldmentCitation62 (courtesy of P. Mayr)
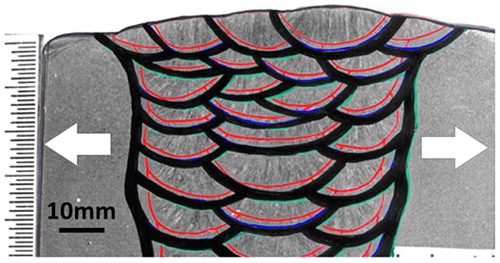
Figure 13. Dendritic solidification substructure observed in P(T)91 after tint etchingCitation67
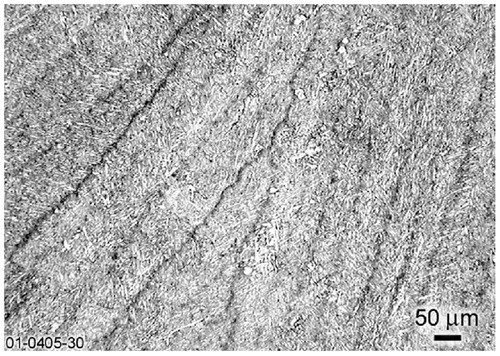
Figure 14. Calculated variations in chromium and carbon concentrations from core of dendrite to interdendritic regionCitation67
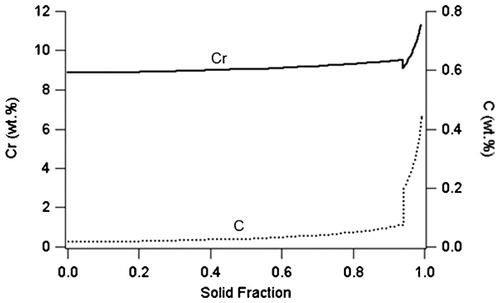
Figure 15. Schematic of friction welding process showing interaction of tool pin with materialCitation76 (courtesy of The Welding Institute)
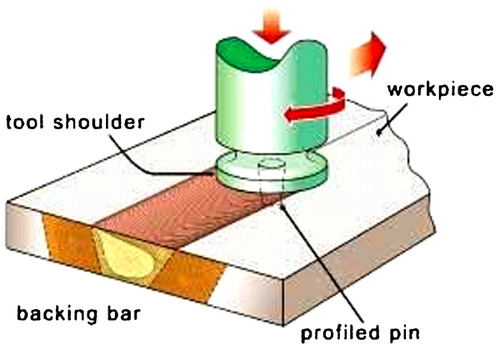
Figure 16. Classification and types of cracking in weldmentsCitation79
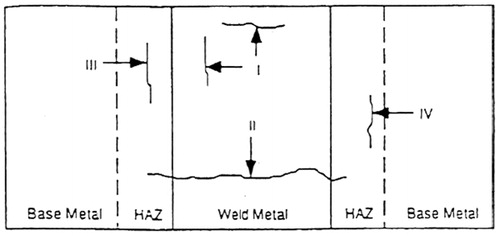
Figure 17. Grade 91 base material creep rupture comparison to Keith Bell type IV failure analysisCitation80
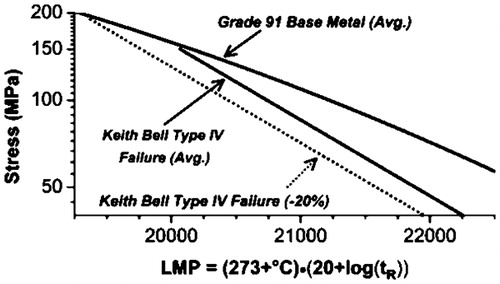
Figure 18. Example of type IV failure location in a cross-weld creep specimen from E911 after 13 945 h at 600°C and 120 MPaCitation82
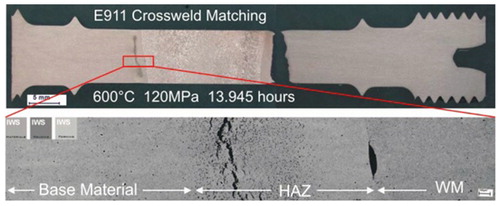
Figure 19. Example of type IV failure, location and electron backscatter diffraction image across HAZ; creep damage indicated by white regions in colour mapCitation82
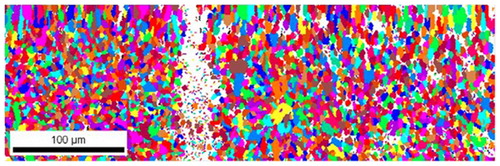
Figure 20. Microhardness profile across P(T)91 weldment in as welded, PWHT and creep tested conditionsCitation86 (with permission of Springer Science)
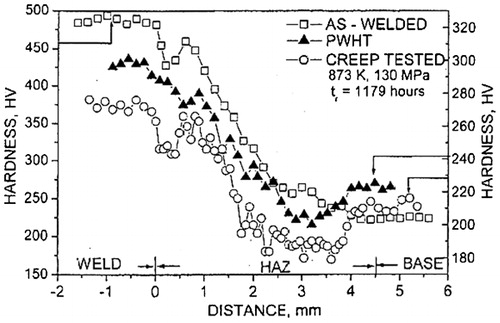
Figure 21. Hardness across ex service Grade 91w. Dark blue through centre of thickness and white areas near top of figure indicate softening, consistent with observations made in ICHAZ. Representative weld was exposed at 580°C for ∼75 k hCitation32
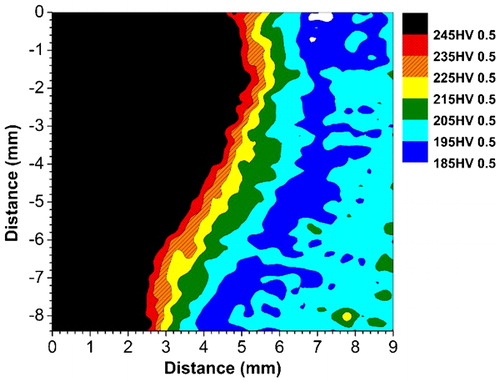
Figure 22. Images (TEM) of normalised and tempered P(T)91 steel a without B and b with BCitation107 (with permission of Springer Science)
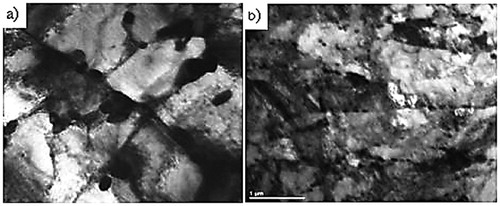
Figure 23. a remelting of weld metal and HAZ of first bead due to thermal effects of second bead; b effect of second layer of weld metal on first layerCitation134
Schematic diagram of temper bead welding process (with permission of Welding Journal)
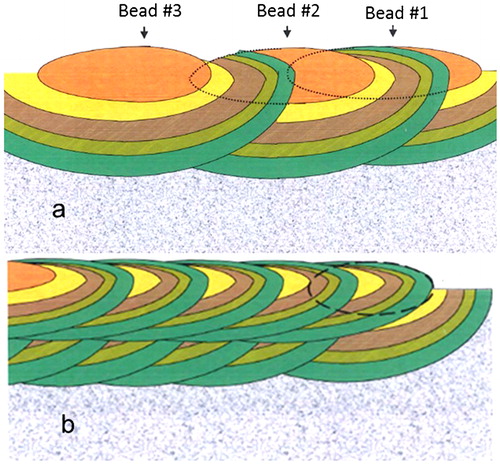
Figure 24. Satoh test shows how residual stresses develop on cooling for various steelsCitation142,Citation143
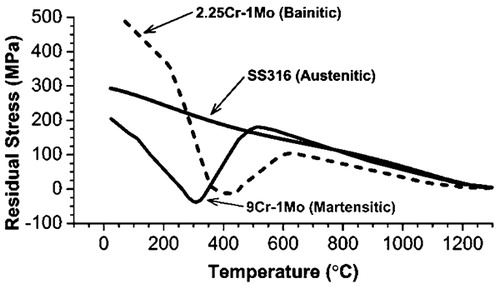
Table 8. Key aspects of variables considered in evaluation of repair techniques for grade 91 piping and componentsCitation32
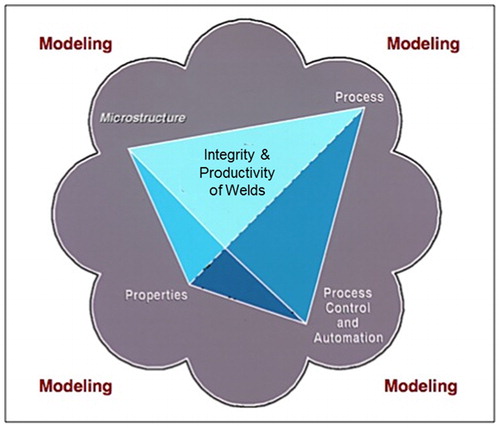
Figure 25. Integration of process, microstructure, properties, process control and automation and their modelsCitation147