
Figures & data
Figure 1. The Index of Orthognathic Functional Treatment Need (IOFTN)
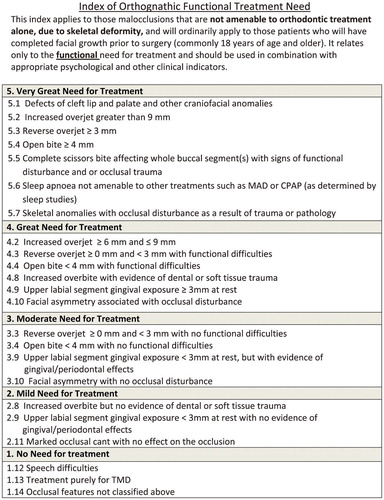
Figure 2. Histogram illustrating the percentage agreement of each of the 21 assessors with the expert panel scores for all of the 23 categories within the IOFTN
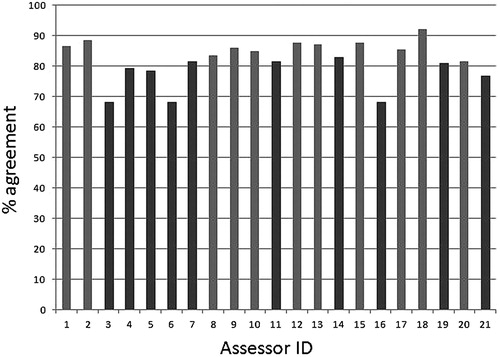
Figure 1. The Index of Orthognathic Functional Treatment Need (IOFTN)
Figure 2. Histogram illustrating the percentage agreement of each of the 21 assessors with the expert panel scores for all of the 23 categories within the IOFTN