Figures & data
Figure 1. Percentage of deaf school age children in Flanders wearing a cochlear implant in February 2010.
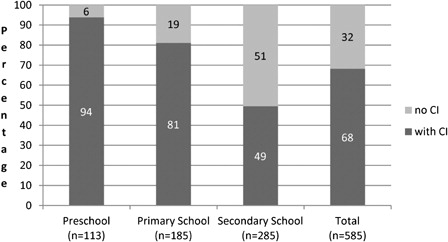
Figure 2. Overview of the number of approved applications for a reimbursement of a CI in Belgium from 1994 till 2010.
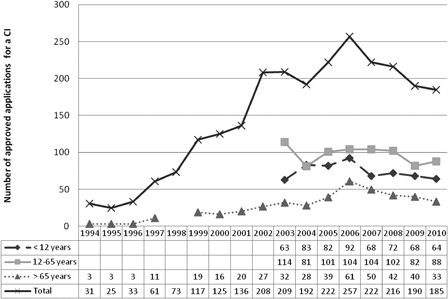
Figure 3. The percentage of applications for a reimbursement of a CI depending on the age of the child as function of the total number of applications for children younger than 12 years.
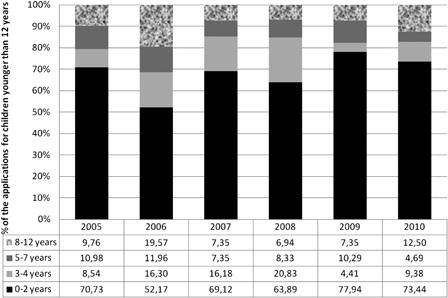
Figure 4. Percentage of Flemish deaf children with a cochlear implant in going to regular schools at pre-, primary and secondary school level from 2006 till 2010.
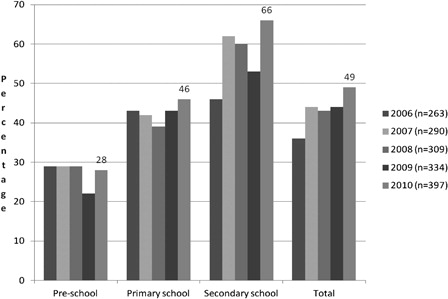
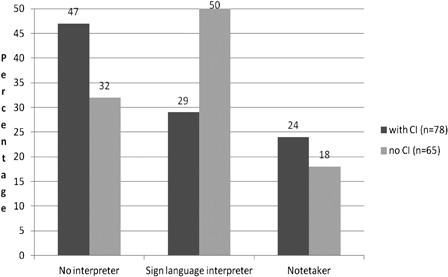
Figure 5. General comparison of the use of an interpreter by deaf children with and without CI at secondary level during school year 2009–2010.