Figures & data
Figure 1. Effect of ATO on proliferation and viability of NB4 cells. To quantify the effect of ATO on cell viability and growth, NB4 cells were grown in the presence of various concentrations of ATO. (A) Cell viability was thereafter assessed by trypan blue exclusion assay. Percent viability was normalized to the untreated cells. Data are shown as the mean ± SD from three independent experiments. Cell viability was also assessed by MTT assays. (B) A dose-dependent reduction in proliferative rate of NB4 cells. (C) A time-dependent decrease in proliferation of NB4 cells.
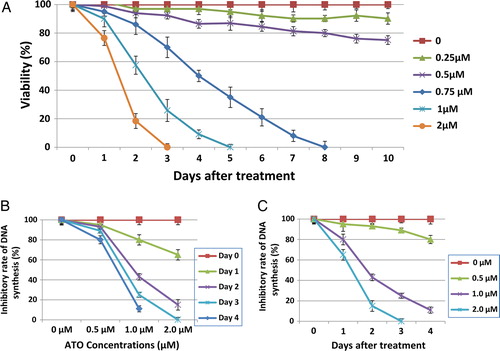
Figure 2. Induction of apoptosis by ATO. To determine whether ATO-induced cell death was due to apoptosis, the NB4 cells were cultured in the presence of various ATO concentrations for 2 days and thereafter dual stained with (A) Hoechst 33342 and PI dyes and examined by fluorescence microscope. The images were captured with red (for Hoechst) and blue (for PI) filters and merged using FISH imaging system. Percentage of cells stained with PI (red) was regarded as the percentage of apoptotic cells. (B) Annexin-V-PE and PI, early and late apoptosis was determined by flow cytometric analysis.
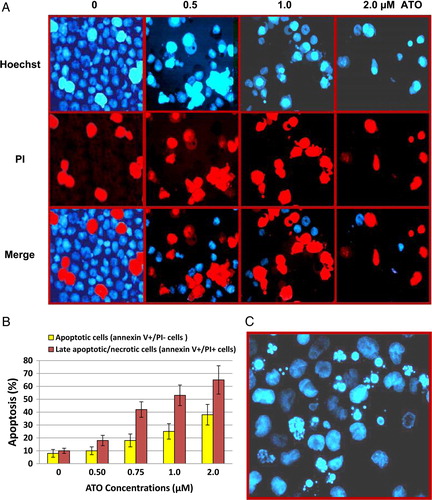
Figure 3. Inhibition of telomerase activity by ATO in NB4 cells. The NB4 cells were grown in presence of various concentrations of ATO. At the indicated time, cells were collected and TA was measured for 1000 cells equivalent per lane using PCR-based TRAP assay. (A) Analyzing of TRAP products of NB4 cells after treating with three doses of ATO (0.5, 1, and 2 µM). TRAP ladder was resolved on an 8% PAGE and visualized by silver staining. (B) NB4 cells treated with 1 µM ATO. (C) NB4 cells treated with 2 µM ATO. M, molecular marker (100 bP and 200 bP); 0 + , adding of arsenic to the cell extract.
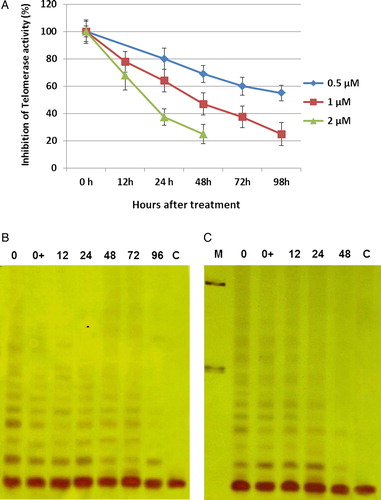
Figure 4. Average telomere length during treatment of NB4 cells with ATO. NB4 cells were grown in presence of various concentrations of ATO (0.25, 0.5, and 0.75 µM). Genomic DNA (1.5 µg) was digested with Rsa1 and Hinf1 restriction enzymes and separated on a 0.8% agarose gel. Telomere length was determined by hybridization with a digoxigenin-labeled telomeric probe (TTAGGG)3 and chemiluminescent detection system. The peak value of TRF lengths were calculated and recorded as TLs. Numbers above each lane represent the day of treatment for each sample. L and H indicate DNA from the low and high telomere length samples, respectively. M represent fluorescent-labeled size markers.
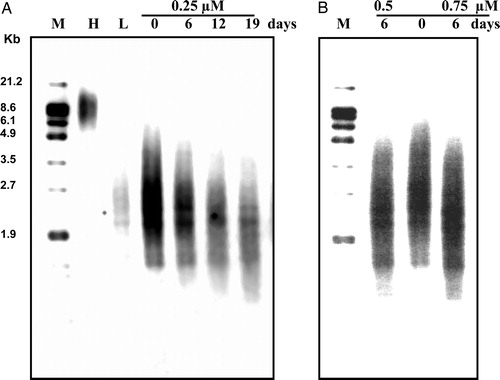
Figure 5. Effects of ATO on activation of NF-κB in NB4 cells. Cells were exposed to desired concentrations of ATO for 48 hours. After the treatment period, the relative phosphorylated level of NF-κB was measured using a cell-based ELISA assay. Values are given as mean ± SD statistically different value of **P < 0.01 was determined compared with the control.
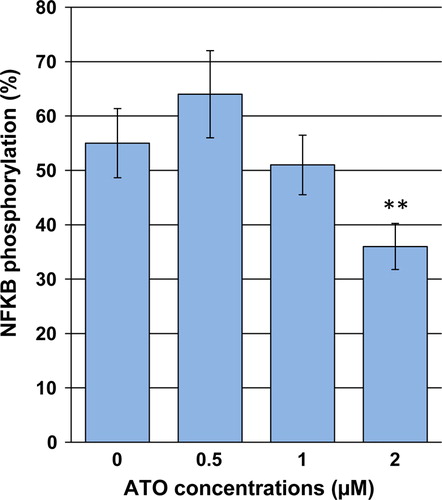
Figure 6. Effect of ATO on transcriptional levels of Pin1, hTERT, c-Myc, PinX1, survivin, and p73. The relative mRNA expression of each gene was measured using real-time reverse transcriptase-PCR in ATO-treated NB4 cells after normalizing the cycle thresholds of each triplicate against their corresponding HPRT. Values are given as mean ± SD statistically different values of *P < 0.05 and **P < 0.01 were determined compared with the control.
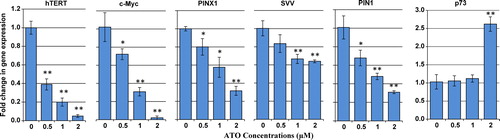
Table 1. Nucleotide sequence of the primers used for real-time RT-PCR