Figures & data
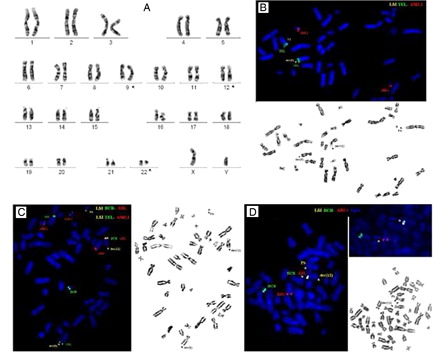
Figure 1. G-banded metaphase from the diagnostic bone marrow showing the complex karyotype 46,XY,t(9;22;12)(q34;q11;p11) (A). FISH with the dual color, TEL-AML1 probe on metaphases showed juxtaposition of TEL from 12p13 to chromosome 9 generating signal (green signal) on der(9) (B). Dual Color FISH probe for BCR-ABL revealed variant location of BCR-ABL1 fusion, revealing the fusion BCR-ABL1 signal on a der(12) instead of a der(22) (C and D).