Figures & data
Figure 1. The expression of the GP IIb/IIIa (CD41/CD61) in ITP, non-ITP patients and healthy control, showed as the flow cytometric diagram: in the left figure, the C3 quadrant demonstrated the platelet gated by flow cytometry; in the right figure, the C1, C2, C3, and C4 quadrant represented the percentage of CD41−/CD61+, CD41+/CD61+, CD41−/CD61−, and CD41+/CD61−, respectively. (A) The expression of GPIIb/IIIa (CD41/CD61) in one of the healthy controls: platelet were gated 99.7% by flow cytometry; the percentage of CD41+/CD61−, CD41−/CD61+, and CD41+/CD61+ was 0.1, 0.6, and 95.7%, respectively. (B) The expression of GPIIb/IIIa (CD41/CD61) in one of the ITP patients: platelets were gated 96.0% by flow cytometry. The percentage of CD41+/CD61−, CD41−/CD61+, and CD41+/CD61+ was 1.4, 65.8, and 0.5%, respectively. (C) The expression of the GPIIb/IIIa (CD41/CD61) in one of the non-ITP patients: platelets were gated 98.1% by flow cytometry. The percentage of CD41+/CD61−, CD41−/CD61+, and CD41+/CD61+ was 0.2, 8.6, and 87.3%, respectively.
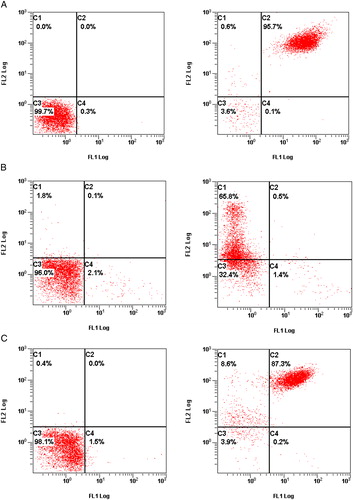
Figure 2. The frequencies of circulating B cells secreting anti-GP IIb/IIIa antibody and the expression of the GP IIb/IIIa (CD41/CD61) in ITP, non-immune thrombocytopenia patient and health control determined by ELISPOT and FCM. (A) The frequencies of circulating B cells secreting anti-GP IIb/IIIa antibody in different group. Each experiment was conducted in four independent wells, and the results represent the mean of the four values. The cutoff value which was set at 5 SD above the mean of the healthy controls, was shown by a line (3.7/105 PBMC). (B) The expression of the GP IIb/IIIa (CD41/CD61) in different group. The cutoff value, which was set at the best sensitivity and specificity dot in ITP patients’ ROC curve, was shown by a line (43%).
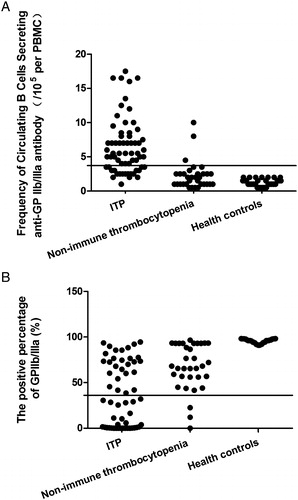
Figure 3. Comparison of the different assays for the diagnosis of ITP between different patient groups and controls. (A) Platelet count in different patient and control groups. (B) Frequency of circulating B cells secreting anti-GP IIb/IIIa antibody. (C) Platelet GP IIb/IIIa (D) anti-GP IIb/IIIa antibody.
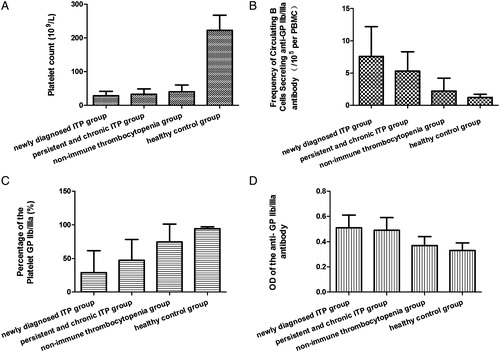
Figure 4. The ROC of the frequency of circulating B cells secreting anti-GP IIb/IIIa antibody and the platelet GP IIb/IIIa in ITP patients and non-immune thrombocytopenia patients. (A) Circulating B cells secreting anti-GP IIb/IIIa antibody: the area under ROC curve is 0.885, the standard error is 0.039, 95% confidence interval is 0.810, 0.961. (B) Platelet GPIIb/IIIa: the area under ROC curve is 0.807, the standard error is 0.047, 95% confidence interval is 0.715, 0.900.
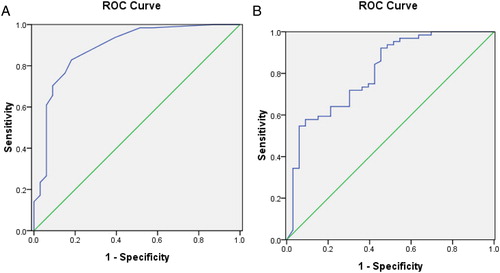
Table 1. The circulating B cells secreting anti-GP IIb/IIIa antibody, platelet GP IIb/IIIa and anti-GP IIb/IIIa antibody in ITP patients and non-ITP patients