Figures & data
Table 1. Comparison of patient characteristics at study start in patients with ‘true ET’ versus rediagnosed early PMF
Figure 1. Reports of deaths and transformations to MDS and WHO-compatible myelofibrosis (%) during at least 7 years of follow-up in relation to new diagnosis after review of bone-marrow specimens. *WHO-compatible overt myelofibrosis; MDS: Myelodysplastic syndrome; ET: Essential thrombocytosis; PMF: primary myelofibrosis.
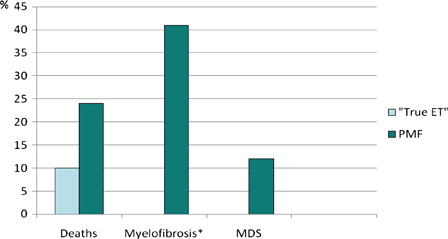
Table 2. Grade of bone marrow fibrosis in 35 available bone marrow biopsies after at least 7 years of observation
Figure 2. Grade 1–4 side effects (WHO grading scale) during the early phase of the study (n = 60) and at 7 years follow-up among patients still treated with anagrelide (n = 26). No grade 4 side effects were recorded at 7 years.
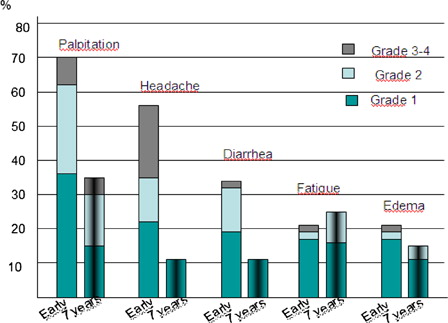
Table 3. Thrombotic and hemorrhagic events during study period in patients with an initial diagnosis of ET and PV