Figures & data
Figure 1. Median and range of 25(OH)D concentrations were in B-CLL (16.1; 6.6–31.0 ng/ml), in NHL (18.8; 7.5–24.7 ng/ml) and control groups (32.4; 25.0–40.8 ng/ml). There are significant reduction in serum 25(OH)D levels in B-CLL patients and NHL patients as compared with healthy controls (P = 0.00).
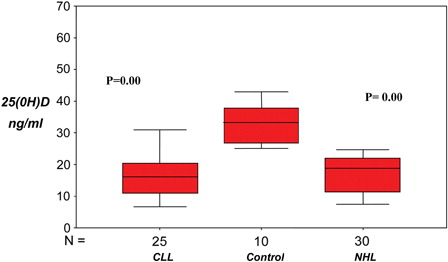
Table 1. Association between 25(OH)D concentrations and prognostic markers inB-CLL patients
Table 2. Association between 25(OH)D concentrations and prognostic markers of NHL patients
Table 3. Cox regression multivariate analysis of 25(OH)D and other prognostic factors in B-CLL
Table 4. Cox regression multivariate analysis of 25(OH)D and other prognostic factors in NHL
Figure 2. Kaplan–Meier curve for OS in high-risk B-CLL versus low-risk B-CLL patients subgroup. There are significant shortening in the OS in the high-risk group as compared with the low-risk group (P = 0.04).
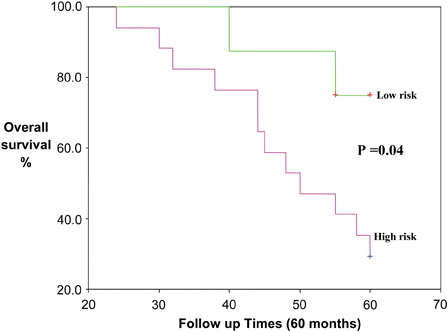
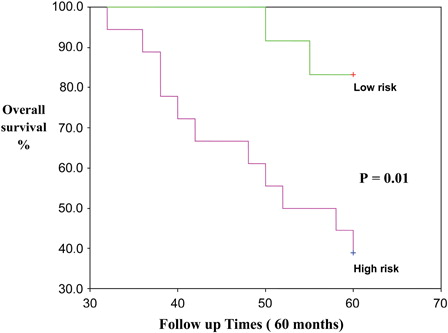
Figure 3. Kaplan–Meier curve for OS in high-risk NHL subgroup as compared with the low-risk NHL patient's subgroup. There are significant shortening in the OS in high-risk group as compared with the low-risk group (P = 0.01).